

Euro[1] reversed off confluence support last week with the advance now approaching the first major resistance hurdles. Here are the updated targets and invalidation levels that matter on the EUR/USD charts heading into the start of the week. Review this week’s Strategy Webinar[2] for an in-depth breakdown of this setup and more.
EUR/USD Daily Price Chart
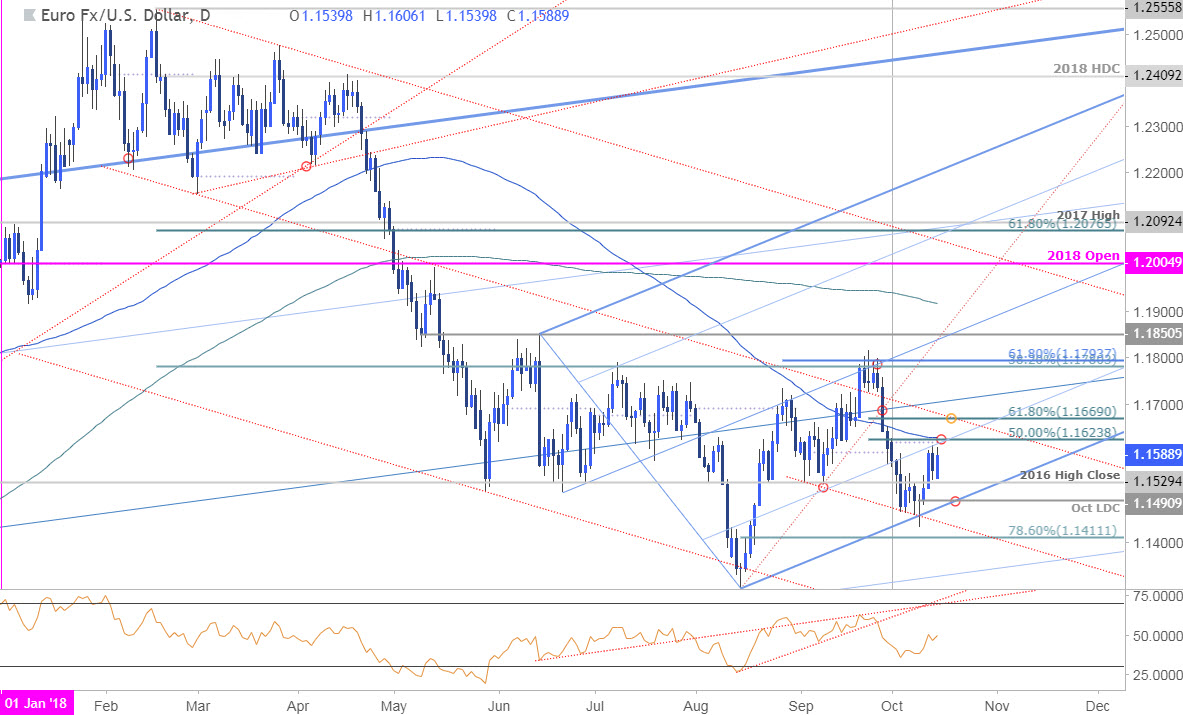
Technical Outlook: Earlier this month in my EUR/USD Weekly Technical Perspective[3] we highlighted a key support zone at in Euro at 1.1436/97 (low-week reversal close and the 61.8% retracement of the August advance). Price registered a low at 1.1432 on October 9th with the subsequent rebound faltering just ahead of a key resistance confluence at 1.1617/27 – a region defined by the monthly open & opening-range highs, the 50% retracement[4] of the late-September decline and the 100-day moving average. A breach above this level targets 1.1669 (breakout-zone for the Euro). Initial daily support rests at 1.1529 backed by the monthly low-day close at 1.1491.
New to Forex Trading? Get started with this Free Beginners Guide[5]
EUR/USD 240min Price Chart
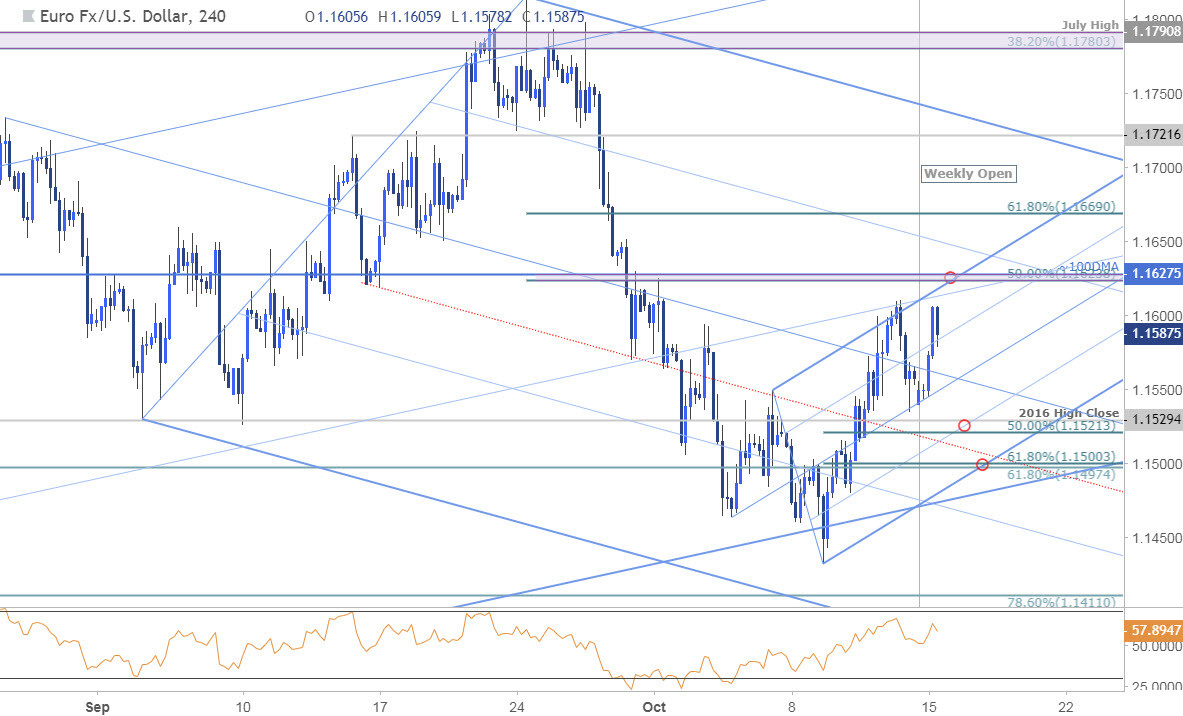
Notes:A closer look at near-term price action shows Euro trading within the confines of an ascending pitchfork formation[6] extending off the October lows. Note that the upper parallel converges on the 1.1617/27 resistance zone and further highlights the technical significance of this region. Initial resistance rests with the median-line (currently 1.1550s) backed by 1.1521/29 with near-term bullish invalidation now raised to 1.1497-1.15.
Why does the average trader lose? Avoid these Mistakes in your
