

The British Pound[1] recovered off the August support line with prices now threatening yearly down-slope resistance early into the start of October / 4Q trade. Here are the updated targets and invalidation levels that matter on the GBP/USD charts this week. Review this week’s Strategy Webinar[2] for an in-depth breakdown of this setup and more.
GBP/USD Daily Price Chart

Technical Outlook: We’ve been tracking this descending pitchfork in GBP/USD for months[3] now with false-break of the lower parallel last week charging a recovery back above the median-line. Note that daily RSI[4] held above 40 on the most recent pullback and keeps momentum on the side of the bulls for now. Initial resistance stands at the 61.8% retracement at 1.3155 with a breach / close above the 38.2% slope line needed to keep the long-bias in play.
Daily support rests with the monthly open at 1.3031 and is backed closely by trendline[5] confluence around the 1.30-handle. Ultimately a break below the 1.2877-1.2905 support zone would be needed to mark resumption of the broader downtrend.
New to Forex Trading? Get started with this Free Beginners Guide[6]
GBP/USD 240min Price Chart
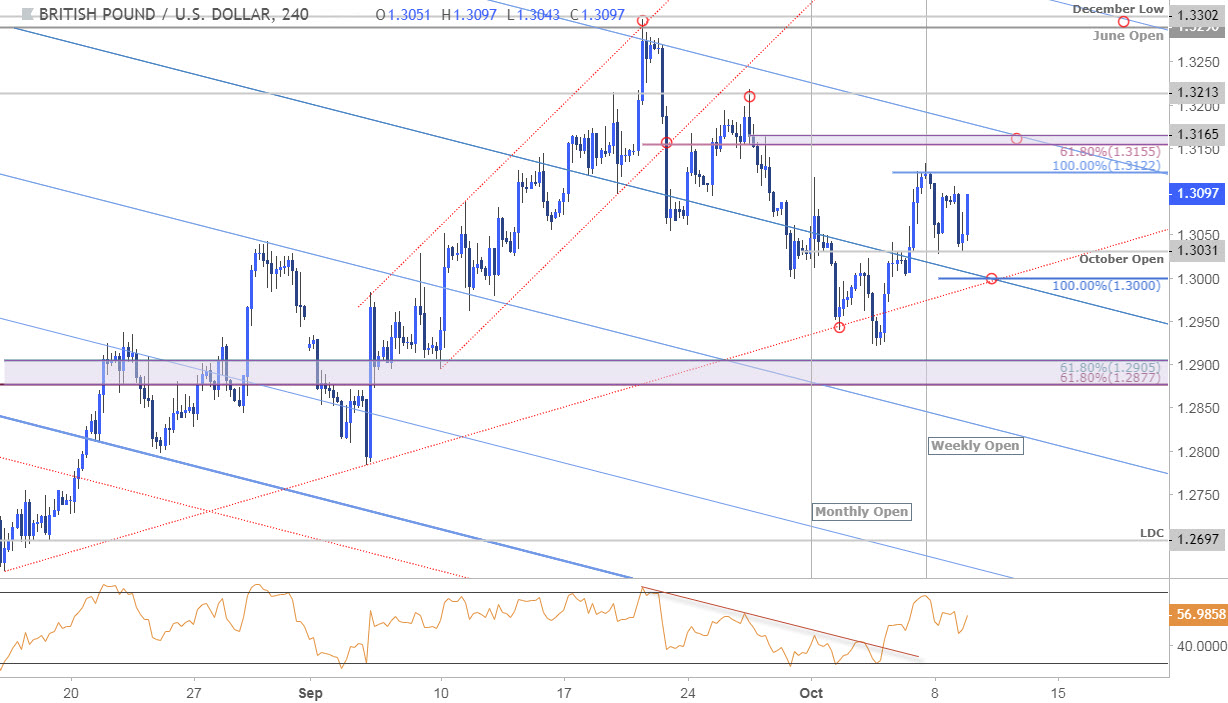
Notes: A closer look at price action highlights the August trendline (red) and keeps our near-term focus weighted to the topside while above 1.30. Initial resistance targets are eyed at 1.3122 and targets 1.3155/65- a breach there is needed to fuel the next leg higher with such a scenario targeting 1.3213 and more significant resistance at 1.3290-1.3302.
Why
