

The Canadian Dollar[1] is on the offensive with news of a renewed US / Mexico / Canada trade agreement further supporting the Loonie early in the week. Here are the updated targets and invalidation levels that matter on the USD/CAD charts heading into the start of October trade. Review this week’s Strategy Webinar[2] for an in-depth breakdown of this setup and more.
USD/CAD Daily Price Chart
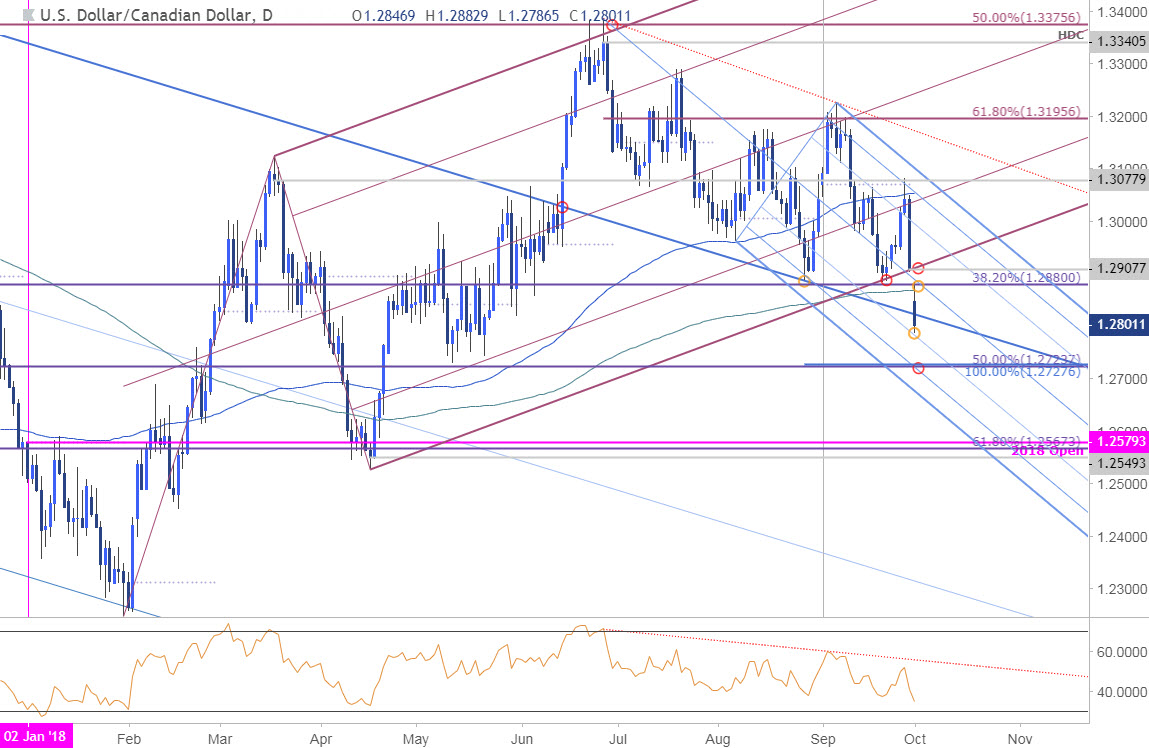
Technical Outlook: In my most recent Weekly Technical Perspective on the USD/CAD[3], we highlighted a key confluence support zone at 1.2880– with, “The risk remains weighted to the downside in USD/CAD while below 1.3130.” Price gapped lower into the weekly / monthly open with the decline marking a break below 2018 up-trend support (purple) and the 200-day moving average. Initial daily support now rests with the lower 50-line of the descending pitchfork[4] formation extending off the yearly highs.
New to Forex Trading? Get started with this Free Beginners Guide[5]
USD/CAD 240min Price Chart
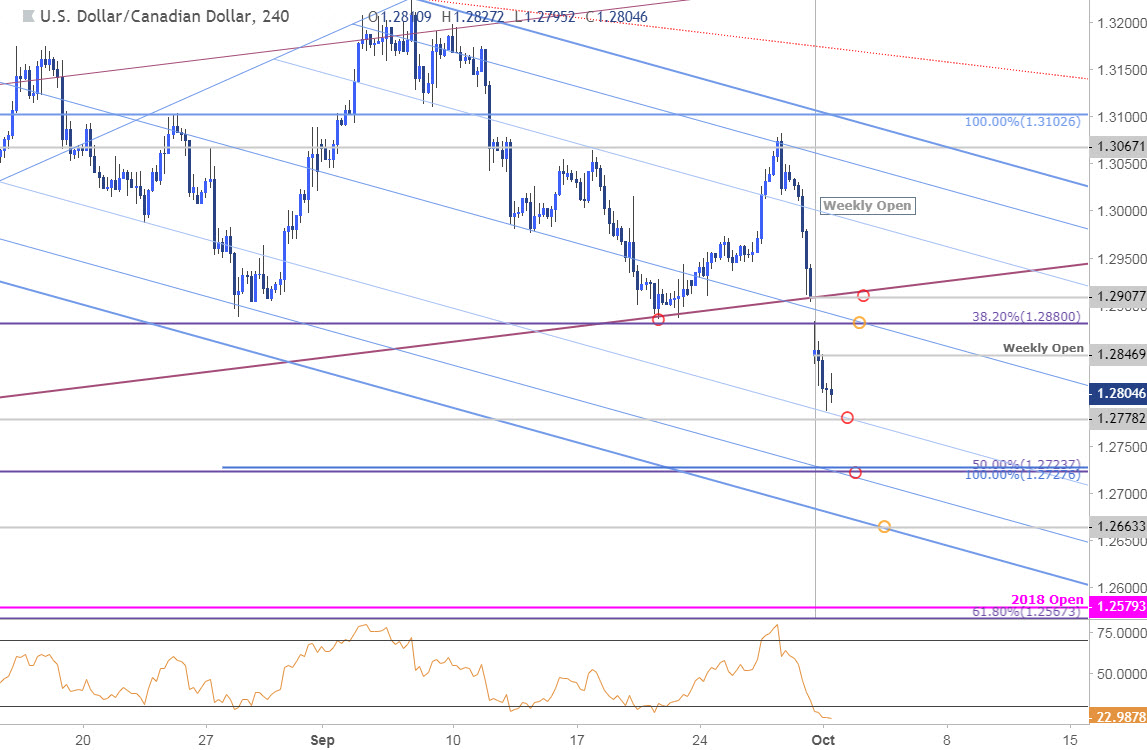
Notes: A closer look at Canadian Dollar price action further highlights the weekly gap open with the opening range high converging on the 38.2% retracement of the 2017 advance at 1.2880. We’ll reserve the Friday close at 1.2908 as our near-term bearish invalidation level with a breach / close above needed to shift the focus back to the long-side.
Initial support eyed at 1.2778 backed by 1.2724/28- a region is defined by the confluence of the 50% retracement and the 100% extension pf the June declines. Look for a more significant reaction off that threshold
