

In this series we scale-back and take a look at the broader technical picture to gain a bit more perspective on where we are in trend. The Canadian Dollar rallied to a 15-week high against the US Dollar[1] last week (USD/CAD lower) with a near-term recovery in price likely to offer opportunities in the days ahead. Here are the key targets & invalidation levels that matter on the USD/CAD[2] weekly chart.Review this week’s Strategy Webinar[3] for an in-depth breakdown of this setup and more.
New to Forex Trading? Get started with this Free Beginners Guide[4]
USD/CAD Weekly Price Chart
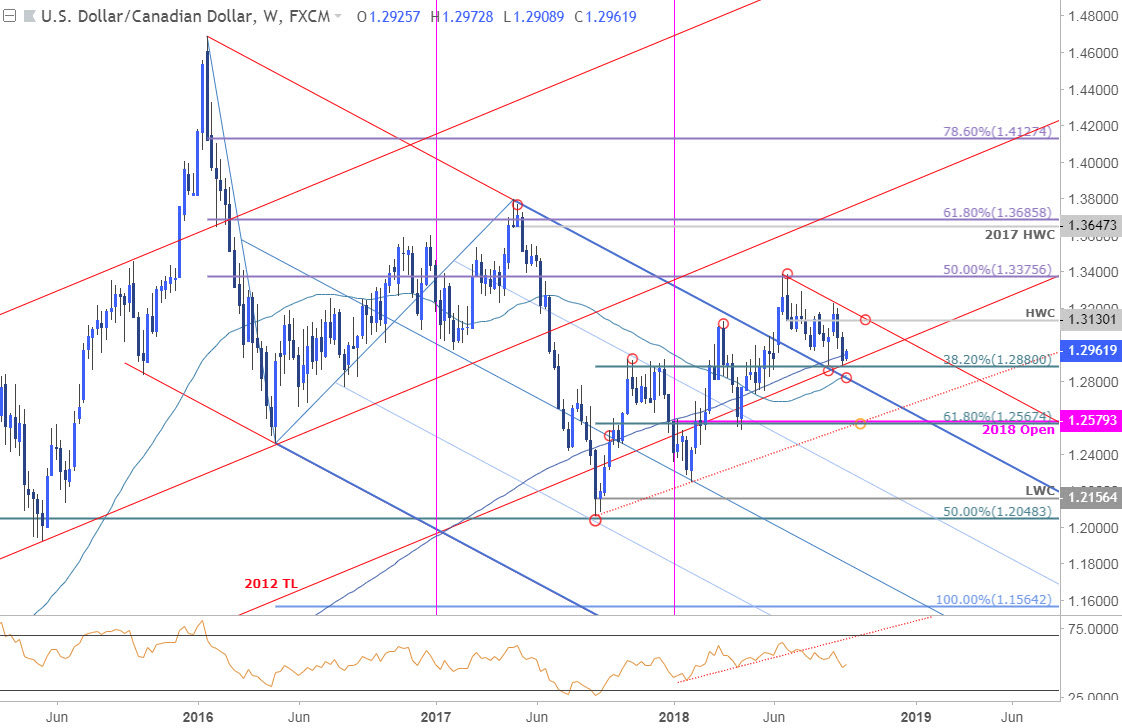
Notes: USD/CAD is trading just above confluence support at 1.2880[5]- a region defined by the 38.2% retracement of the 2017 advance, the August low and the 2012 trendline. This key barrier is backed closely by the 1.2830 where 52-week moving average converges on former pitchfork[6] resistance.
Its decision time for the Loonie - a break below these levels would be needed to suggest a more significant high is in place with such a scenario eyeing subsequent confluence support objectives at 1.2567/79 - (61.8% retracement[7], 2018 open and 2017 trendline support). Interim resistance stands with the yearly high-week close at 1.3130 with bearish invalidation up at the June trendline, currently ~1.3190s.
For a complete breakdown of Michael’s trading strategy, review his Foundations of Technical Analysis series on Building a Trading Strategy[8]
Bottom line: The risk remains weighted to the downside in USD/CAD while below
