

In this series we scale-back and take a look at the broader technical picture to gain a bit more perspective on where we are in trend. Crude oil has rallied more than 11% off the August lows[1] with prices now approaching topside resistance targets. Here are the key targets & invalidation levels that matter on the Crude Oil[2] weekly chart. Review this week’s Strategy Webinar[3] for an in-depth breakdown of this setup and more.
New to Forex Trading? Get started with this Free Beginners Guide[4]
Crude Oil Weekly Price Chart (WTI)
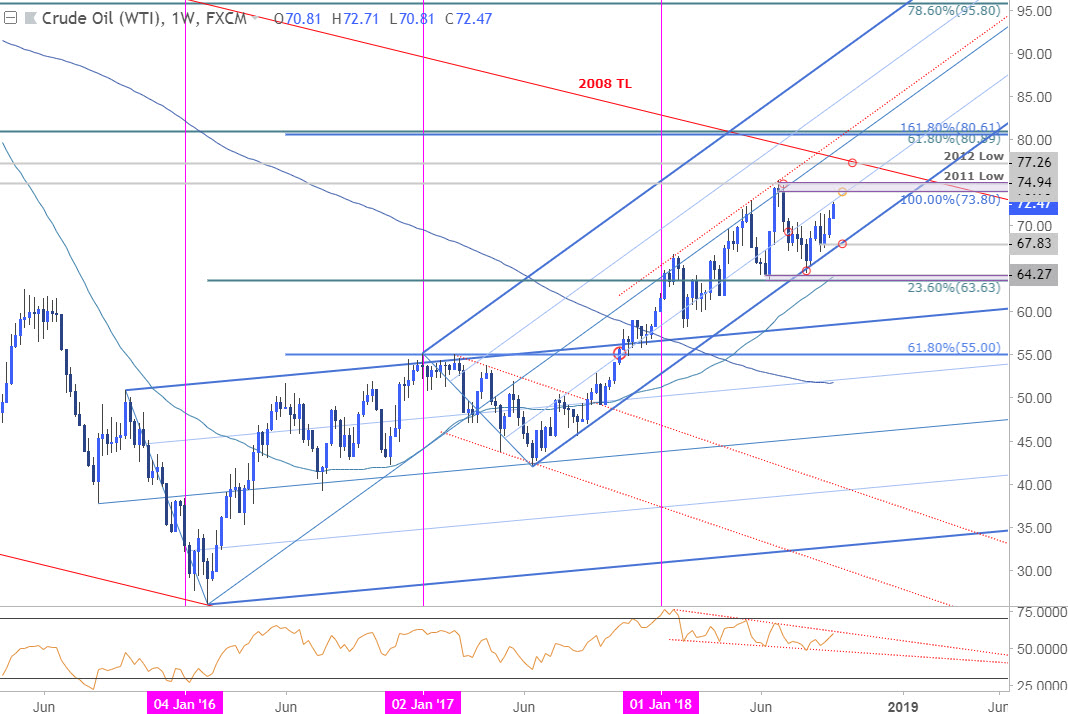
Notes: Crude oil has continued to trade within the confines of a well-defined ascending pitchfork formation extending off the 2016 lows with prices rebounding from support at the lower parallel last month. In my previous WTI price outlook[5], our bottom line stated that crude prices had, “responded to key longer-term structural support and leaves the risk weighted to the topside while above 67.” The subsequent advance took out our final target at 71.14 yesterday with price now testing parallel[6] resistance at the 50-line.
A breach above this threshold targets key resistance at 73.80/94- a region defined by the 100% extension of the August advance, the yearly high-week close, and the 2011 low. Subsequent major resistance confluences[7] are eyed at 77.26 and 80.61/89. Weekly support rests at 67.83 with broader bullish invalidation steady at 63.63.
For a complete breakdown of Michael’s trading strategy, review his Foundations of Technical Analysis series on Building a Trading
