

The Japanese Yen[1] has been under considerable pressure over the past few days after price (USD/JPY) responded to a key support confluence. Here are the updated targets and invalidation levels that matter on the USD/JPY charts heading into Jackson Hole this weekend. Review this week’s Strategy Webinar[2] for an in-depth breakdown of this setup and more.
USD/JPY Daily Price Chart
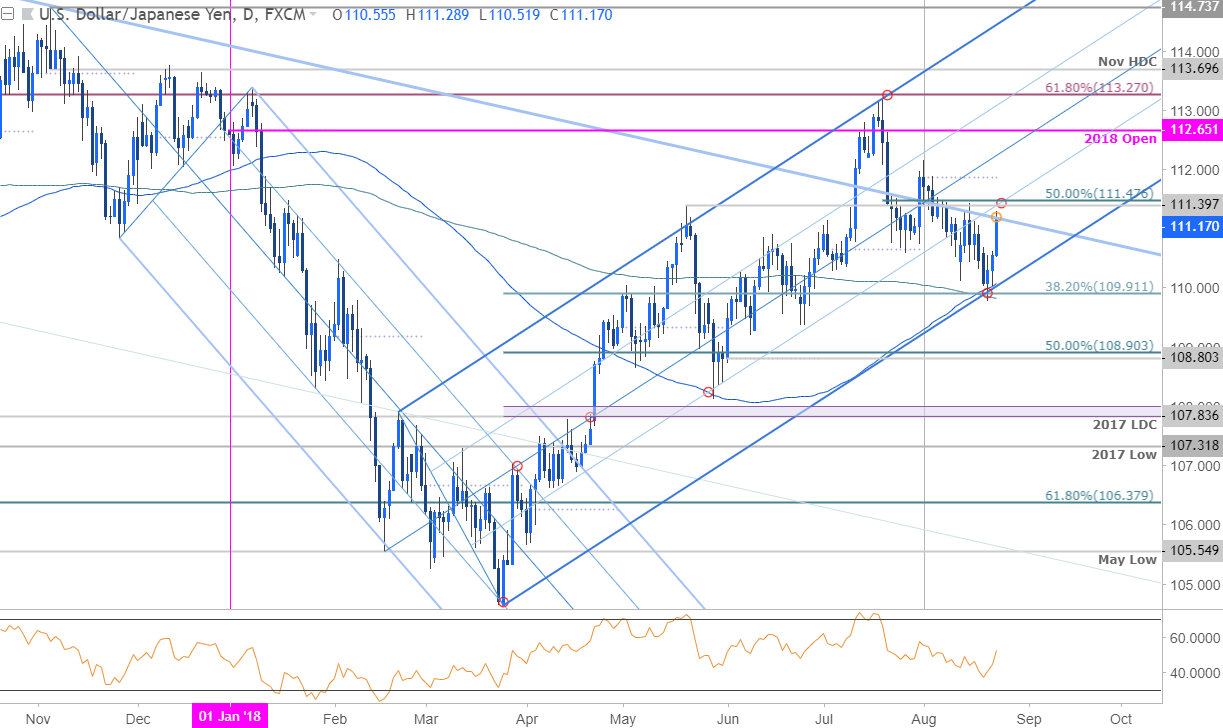
Technical Outlook: In my latest Analyst Pick on USD/JPY[3], we noted that our focus was, “on a drive in to a critical support confluence at, 109.80/91 where the 100 & 200-day moving averages converge on the 38.2% retracement of the March advance and pitchfork support. Look for a reaction there.” Price registered a low at 109.78 early in the week before reversing sharply with the advance now targeting initial resistance hurdles which IF cleared, fuel further upside in price. A daily close above 111.40/48 would be needed to suggest a more Signiant low is in place with such a scenario targeting the monthly open at 111.87.
New to Forex Trading? Get started with this Free Beginners Guide[4]
USD/JPY 240min Price Chart
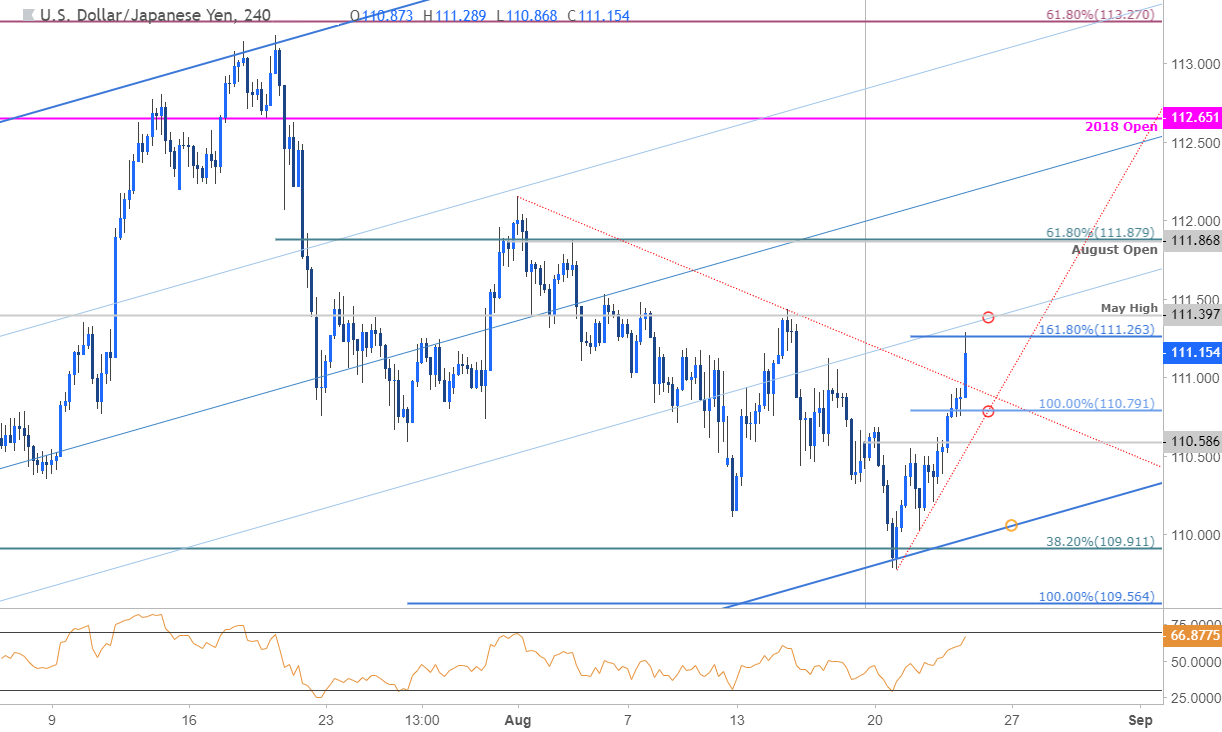
Notes: A closer look at USD/JPY price action further highlight this week’s reversal off key support at 109.91[5] with breach above August trendline resistance shifting the near-term focus higher in price. Immediate resistance targets are eyed at 111.26 backed by 111.40 where the May high converges on the 50-line – looking for near-term exhaustion off one of these levels. Interim support rests at 1110.79 with bullish invalidation at the weekly open at
