

Gold prices[1] have rebounded more than 3% off the yearly lows registered last week with the advance looking a bit vulnerable just ahead of structural resistance. Here are the updated targets and invalidation levels that matter on the XAU/USD charts heading into the close of the week. Review this week’s Strategy Webinar[2] for an in-depth breakdown of this setup and more.
Gold Daily Price Chart
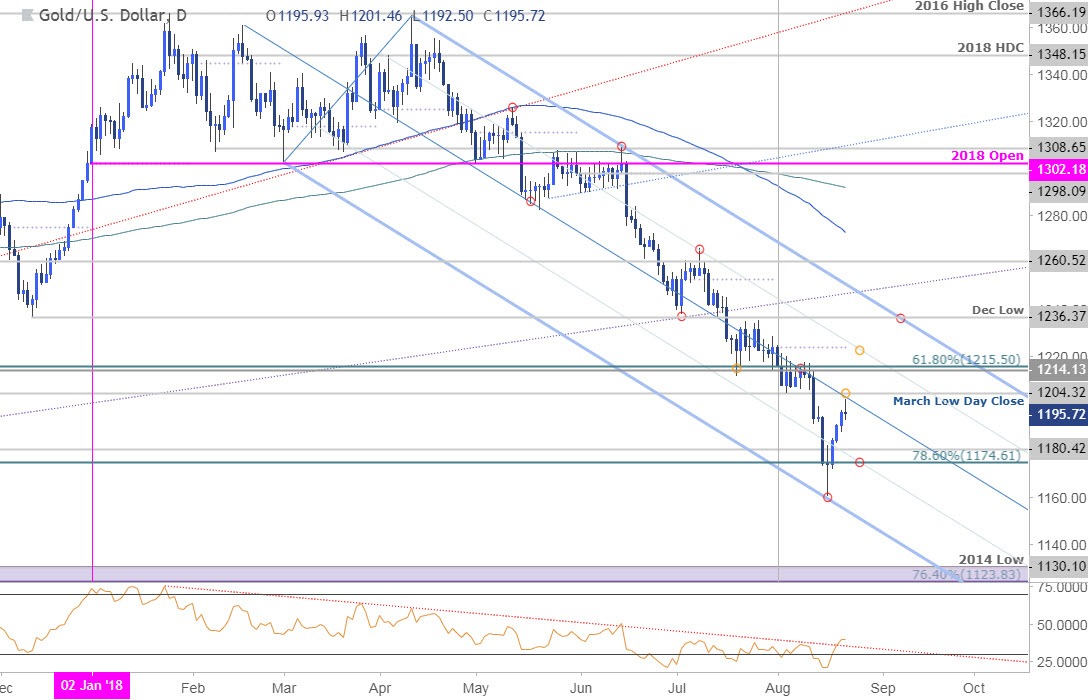
Technical Outlook: In our last Gold Technical Outlook[3] we noted that price had, “responded to down-trend support and threatens a larger recovery - a close above 1180 would bode well for a near-term rebound… From a trading standpoint, reduce / close short-exposure here – be on the lookout for evidence of price exhaustion.” Gold closed at 1184 the following day, keeping our focus weighted to the topside into the close of the week. Note that an RSI resistance trigger dating back to the January highs broke this week and offers further conviction on the long-side of gold prices.
In last week’s Gold Forecast[4], we noted that, “Weekly resistance now stands at 1204/09 with a breach above the median-line needed to suggest a more significant low is in place.” Price registered a high today at 1201 before pulling back and while the broader focus remains higher, the advance remains vulnerable near-term. Interim support rests at 1180 with bullish invalidation now raised to 1174.
New to Forex Trading? Get started with this Free Beginners Guide[5]
Gold 240min Price Chart
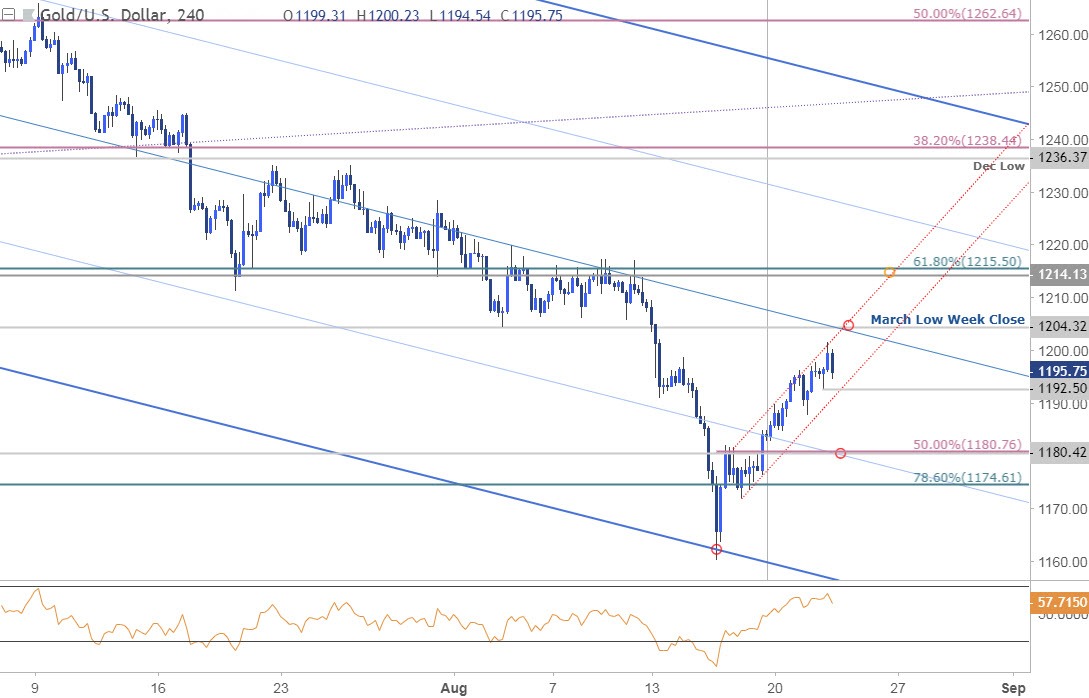
Notes: A closer look at gold price action highlights last week’s reversal
