

The Swiss Franc[1] has been in consolidation for the past few months with USD/CHF trading just below key resistance at the yearly highs. Here are the updated targets and invalidation levels that matter on the USD/CHF charts heading into the close of the week. Review this week’s Strategy Webinar[2] for an in-depth breakdown of this setup and more.
USD/CHF Daily Price Chart

Technical Outlook: USD/CHF has continued to trade within the confines of the initial August opening range. Key confluence support rests at 9890-9902 where the monthly open converges on the 61.8% retracement[3] of the June advance, the 100 day moving average and basic trendline support. Daily resistance stands at 9991- a breach above this region would be needed to validate a near-term breakout targeting key resistance at 1.0058/71 (breach / close above to mark resumption).
New to Forex Trading? Get started with this Free Beginners Guide[4]
USD/CHF 240min Price Chart
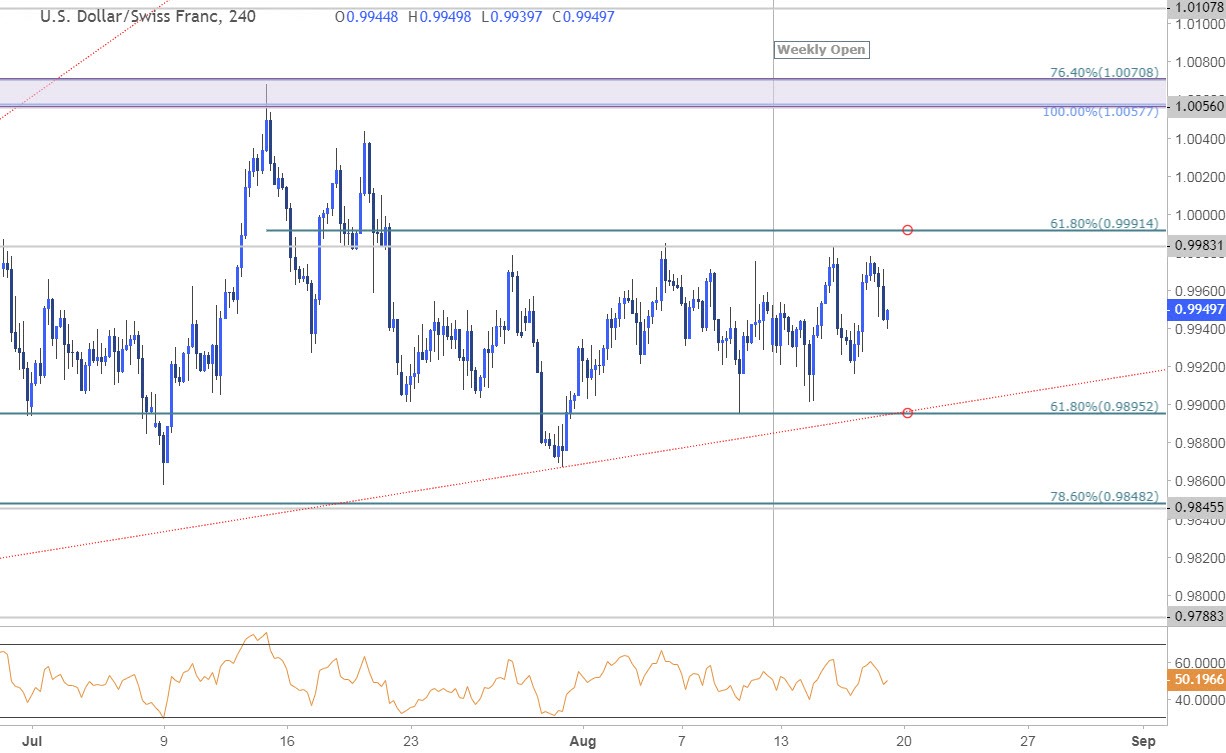
Notes: A closer look at USD/CHF price action further highlights this near-term price consolidation with the pair still holding within the weekly opening range[5]. Until we break this range, treat it as such. A downside break would expose 9846/50 backed by the June lows at 9788.
Why does the average trader lose? Avoid these Mistakes in your trading[6]
Bottom line: USD/CHF remains within a well-defined range and we’re looking for a break of monthly opening-range (9890-9991) to offer further guidance on our near-term directional bias. From a trading standpoint, I’ve favored fading strength while within this zone until
