

Crude oil prices[1] have plummeted nearly 14% off the July highs with the decline now approaching broader up-trend support. Here are the updated targets and invalidation levels that matter on the Crude Oil charts. Review this week’s Strategy Webinar[2] for an in-depth breakdown of this setup and more.
Crude Oil Daily Price Chart (WTI)
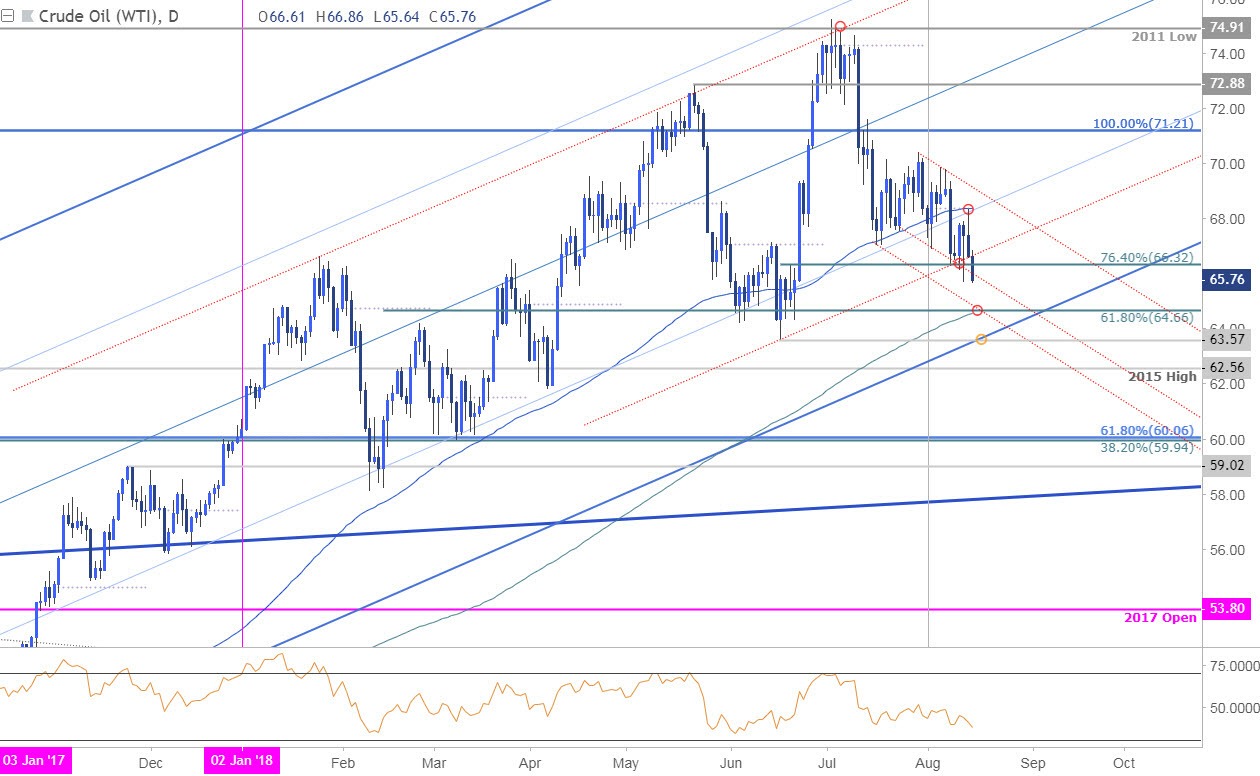
Technical Outlook: In last week’s Technical Perspective on Crude Oil[3] we noted that price had, “broken below parallel support with downside weekly support targets unchanged at 66 and the June close-low / pitchfork support at 64.27.” Crude is breaking to fresh monthly lows today with price approaching areas of near-term support.
Daily confluence support rests at 64.55/66 where the 61.8% retracement of the yearly range converges on the 200-day moving average and down-slope support. Broader structural support rests at the lower parallel (blue) / June lows at 63.57- We’re looking for a reaction / possible exhaustion off one of these levels.
New to Forex Trading? Get started with this Free Beginners Guide[4]
Crude Oil 240min Price Chart (WTI)
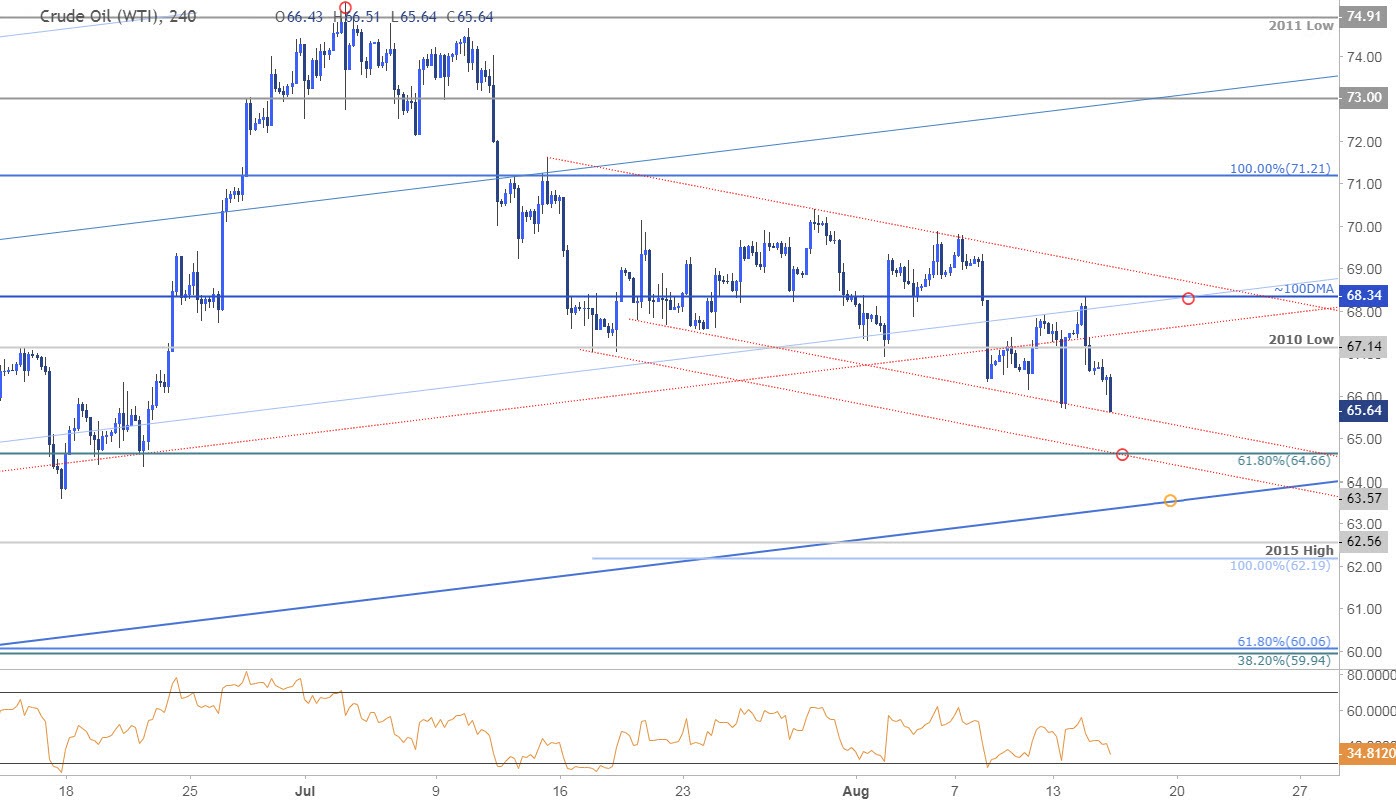
Notes: A closer look at crude price action further highlights the upcoming confluence support targets. Initial resistance stands at 67.14 with bearish invalidation now lowered to 68.34. Ultimately a break below 62.19/56 would be needed to suggest a more significant long-term high is in place with such a scenario targeting confluence Fibonacci[5] support at 59.94-60.06.
Why does the average trader lose? Avoid these Mistakes in your trading[6]
Bottom line: The immediate threat remains lower
