

The Japanese Yen[1] is has been paring gains against the US Dollar[2] since the start of the week with USD/JPY testing initial resistance today in early US trade. Here are the updated targets and invalidation levels that matter on the USD[3]/JPY[4] charts. Review this week’s Strategy Webinar[5] for an in-depth breakdown of this setup and more.
USD/JPY Daily Price Chart
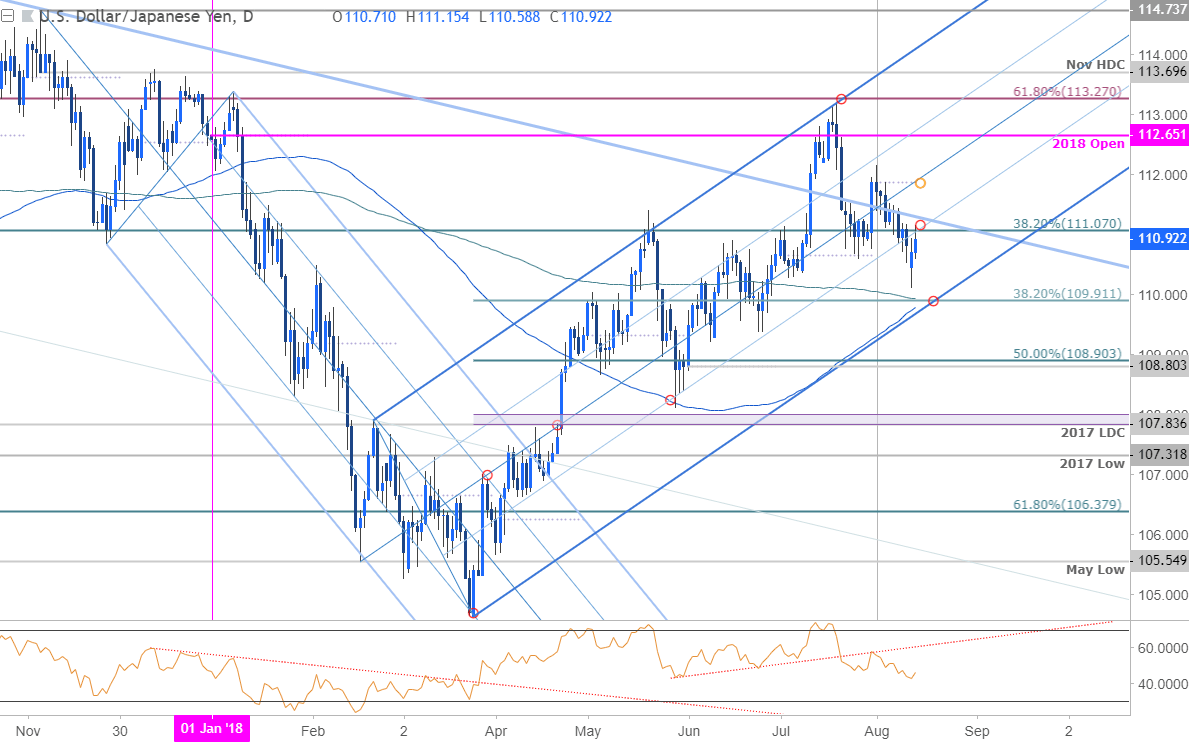
Technical Outlook: In last month’s Technical Perspective on the Japanese Yen[6], we noted that price was testing, “yearly open resistance and could get some kickback but the focus remains weighted to the topside towards confluence resistance just above the 113-handle. From a trading standpoint, look to reduce long-exposure heading into this regions and be on the lookout for possible near-term exhaustion short-entries late in the month.”
USD/JPY registered a high at 113.18[7] just two days later before turning sharply lower[8] with an RSI trigger break further validating the price reversal. Critical daily support rests at 109.80/91 where the 100 & 200-day moving averages converge on the 38.2% retracement of the March advance and pitchfork[9] support.
New to Forex Trading? Get started with this Free Beginners Guide[10]
USD/JPY 240min Price Chart
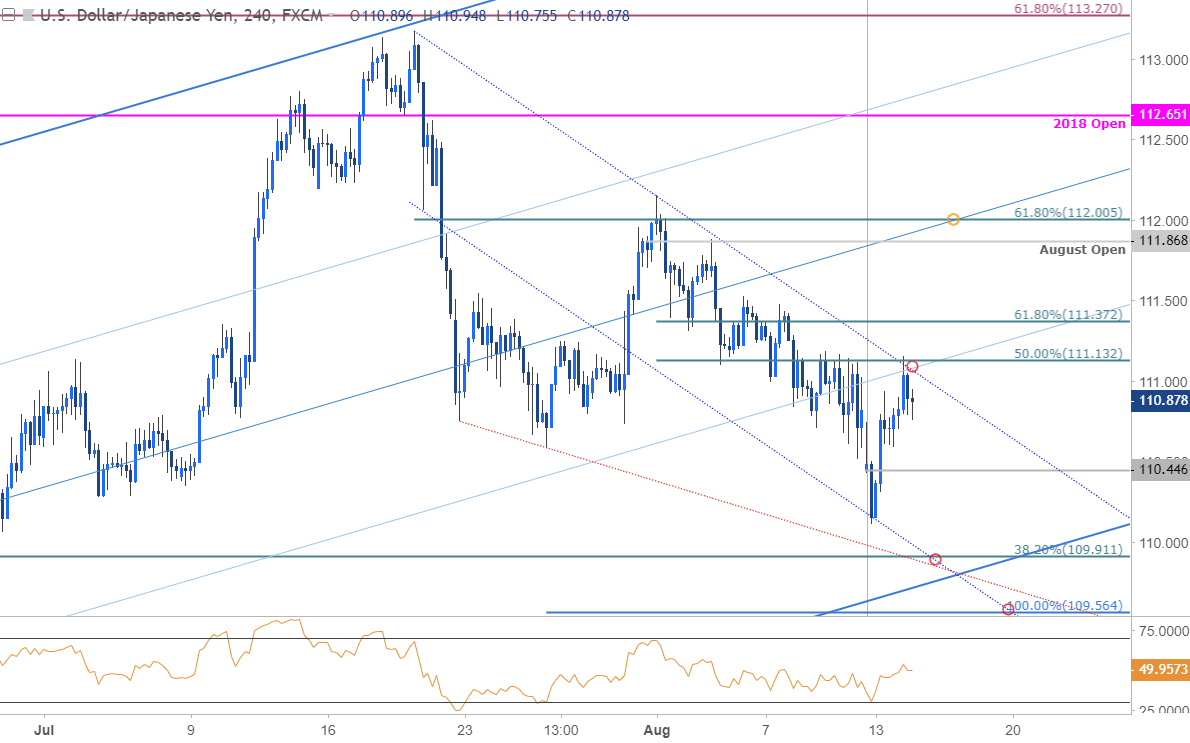
Notes: A closer look at USD/JPY price action highlights a near-term resistance at 111.13- IF prices are indeed heading lower, advances should be capped by 111.37 with support targets eyed at the weekly open at 110.45 backed by 109.80/91 and the 100% extension[11] at 109.56. Ultimately a
