

The British Pound[1] has been in free-fall for the past few days with price down more than 2% since the start of August trade. While the immediate threat remains weighted to the downside, the decline is now approaching long-term structural support with key UK &US event risk on tap tomorrow. Here are the updated targets and invalidation levels that matter for GBP/USD heading into the releases. Review this week’s Strategy Webinar[2] for an in-depth breakdown of this setup and more.
GBP/USD Daily Price Chart
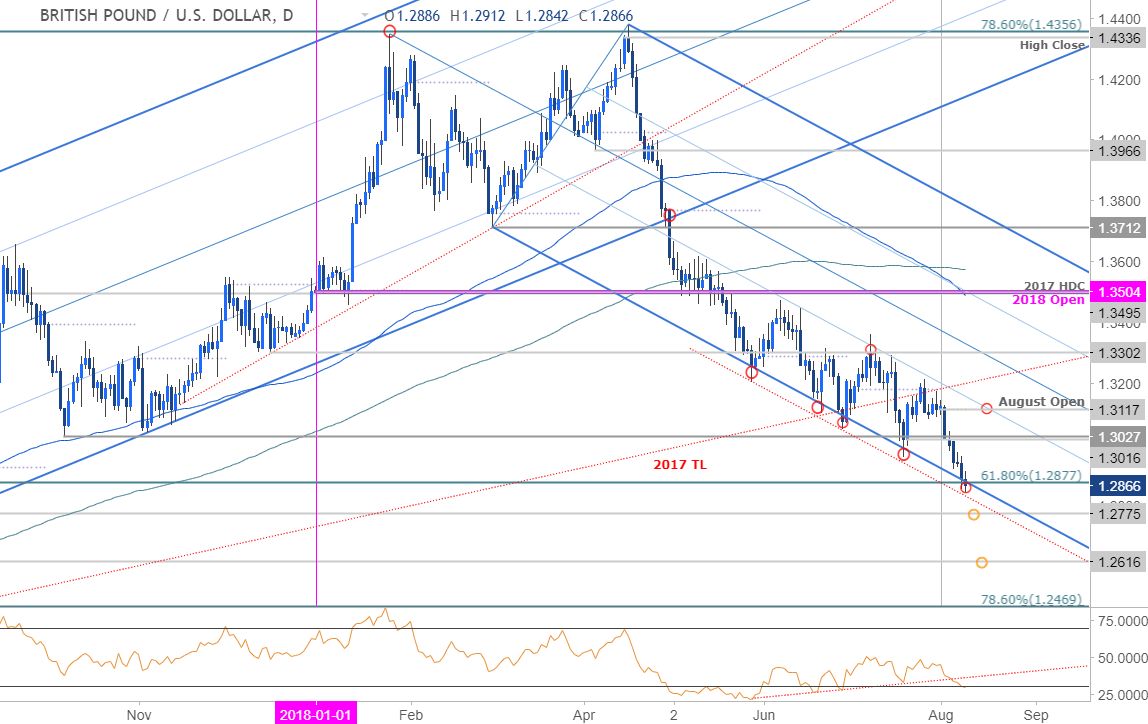
Technical Outlook: In my Weekly Technical Perspective on the British Pound[3], we noted that the broader short-bias in Sterling was, “vulnerable heading into key confluence support around 1.2877. From a trading standpoint, the risk is lower but I’ll be on the lookout for possible exhaustion / long entries on a stretch into the lower parallel.” Note that a sliding parallel (red) of the dominant pitchfork[4] extending off the May lows has seen this slope range catch every subsequent low in price. It’s make-or-break here for Cable.
New to Forex Trading? Get started with this Free Beginners Guide[5]
GBP/USD 240min Price Chart
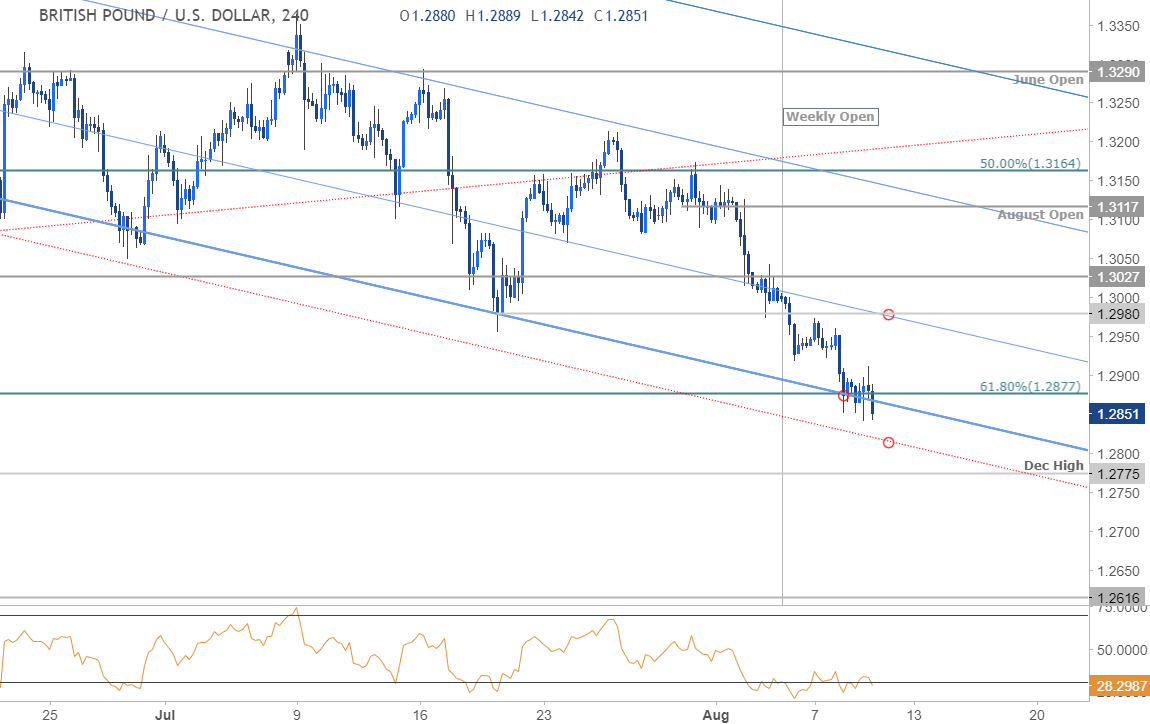
Notes: A closer look at GBP/USD price action further highlights this slope range of support- shorts are vulnerable near-term into this region. Initial resistance stand a 1.2980 backed by 1.3027 with bearish invalidation now lowered to 1.3117. A close below this slope risks accelerated losses with such a scenario targeting 1.2775 backed by 1.2616 and the 78.6% retracement[6] at 1.2469.
Why does the average trader
