

In this series we scale-back and take a look at the broader technical picture to gain a bit more perspective on where we are in trend. AUD/JPY[1] has been trading within the confines of a broad consolidation pattern since the March lows with price now trading just above a critical weekly support confluence. Here are the key targets & invalidation levels that matter on the AUD/JPY[2] weekly chart.
New to Forex Trading? Get started with this Free Beginners Guide[3]
AUD/JPY Weekly Price Chart
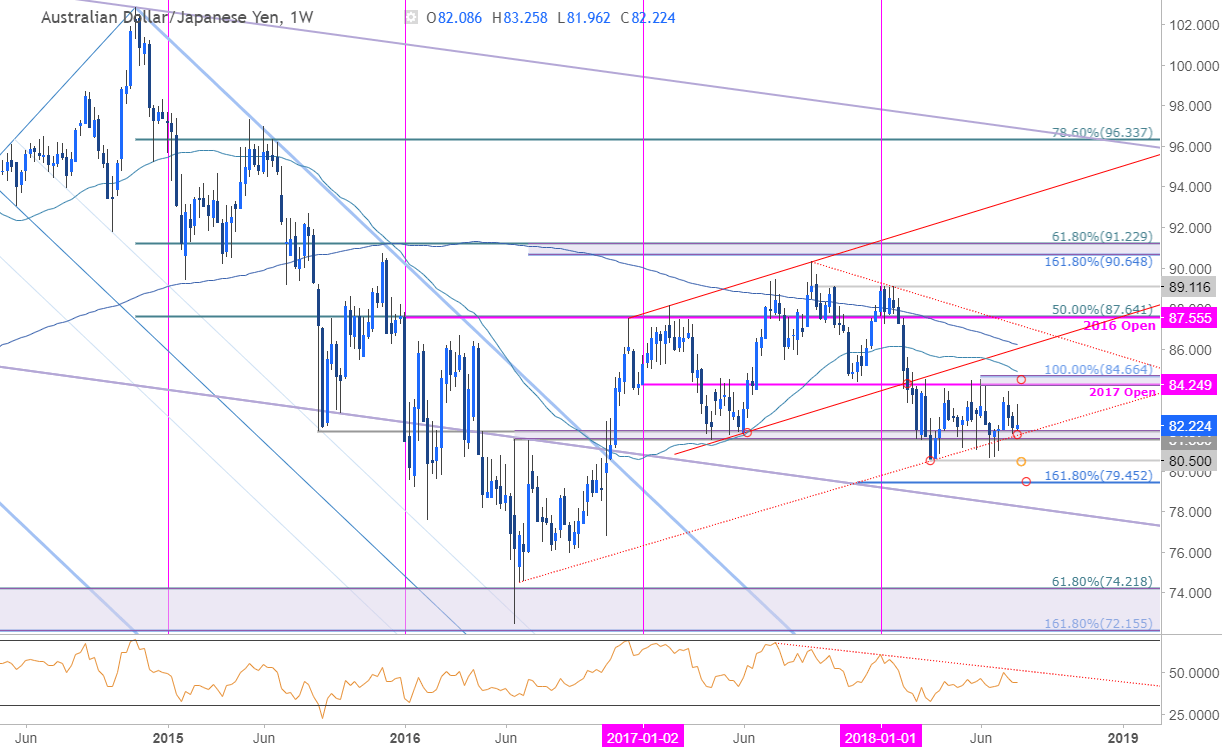
Notes: AUD/JPY opens August trade just above a confluence support pivot we’ve been tracking for months now at 81.58/97 – price has been unable to close below this barrier since March. Basic trendline support[4] extending off the 2016 late-June low converges on this zone into the start of the month and further highlights its technical significance (make-or-break level).
A break below this key support confluence targets the yearly lows at 80.50 backed by the 161.8% extension off the 2017 decline at 79.45. Key weekly resistance & bearish invalidation remains steady at 84.25/66 – a close above this level would be needed to suggest a more significant low is in place with such a scenario targeting the 86-handle.
For a complete breakdown of Michael’s trading strategy, review his Foundations of Technical Analysis series on Building a Trading Strategy[5]
Bottom line: AUD/JPY is trading within a contractionary range with the lower bounds now converging on up-slope support. The broader focus heading into the start of the month will
