

In this series we scale-back and take a look at the broader technical picture to gain a bit more perspective on where we are in trend. The Australian dollar[1] has continued to trade within a well-defined range just above a critical support zone heading into the August open with major event risk on the horizon. Here are the key targets & invalidation levels that matter on the AUD/USD[2] weekly chart.
New to Forex Trading? Get started with this Free Beginners Guide[3]
AUD/USD Weekly Price Chart
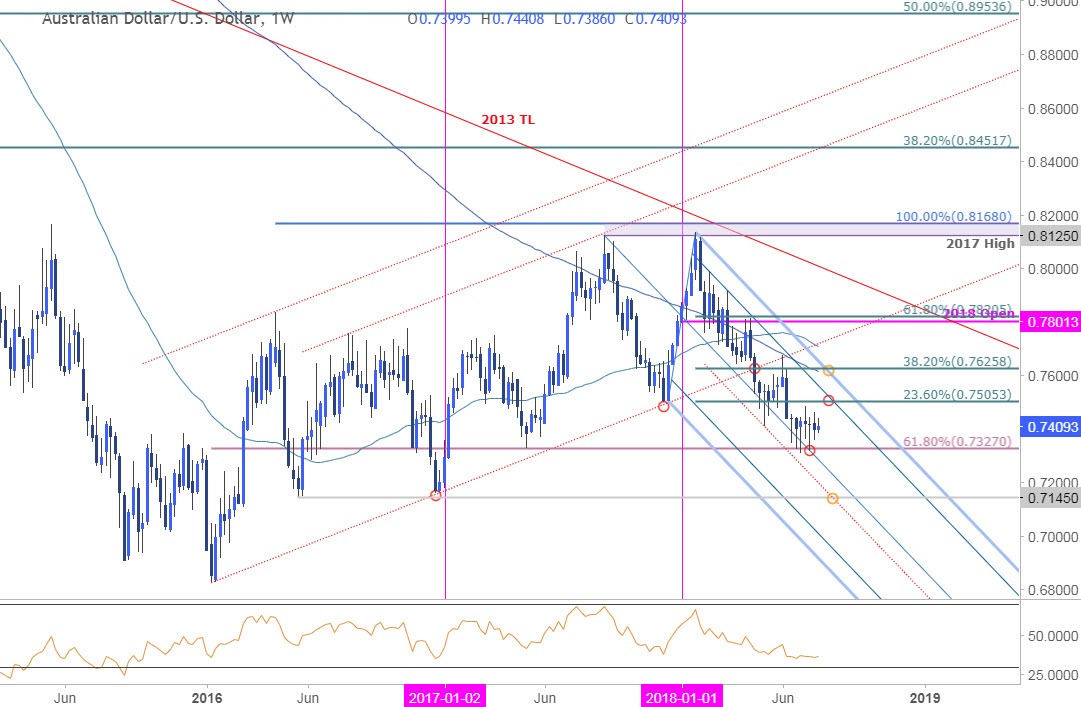
Notes: In my previous AUD/USD Weekly Technical Perspective[4] we highlighted that price was testing, “key support at 7327- a level defined by the 61.8% retracement of the 2016 advance and the May 2017 swing lows.” Nearly a month later and Aussie has continued to hold just above this critical support barrier with price respecting the confines of the July opening range.
Heading into the start of August trade, the focus remains on this key support barrier with initial weekly resistance eyed at 7501/05 where the December lows and the 23.6% retracement of the 2018 range converge on the 75% line of the descending pitchfork formation[5] extending off the 2017 highs. Note that weekly RSI has flattened right at the lows registered in January / December of 2016 and further highlights the near-term threat to the broader downtrend here.
For a complete breakdown of Michael’s trading strategy, review his Foundations of Technical Analysis series on Building a Trading Strategy[6]
Bottom line: Aussie has rebounded
