
In this series we scale-back and take a look at the broader technical picture to gain a bit more perspective on where we are in trend. The Japanese Yen is the strongest performer versus the US Dollar[1] year-to-date with EUR/JPY[2] down 4.44% since December. The rally off the yearly lows turned sharply last week and IF the recovery is to remain viable, price needs to find nearby support in the coming days. Here are the key targets & invalidation levels that matter on the EUR/JPY weekly chart. Review this week’s Strategy Webinar[3] for an in-depth breakdown of this setup and more.
New to Forex Trading? Get started with this Free Beginners Guide[4]
EUR/JPY Weekly Price Chart
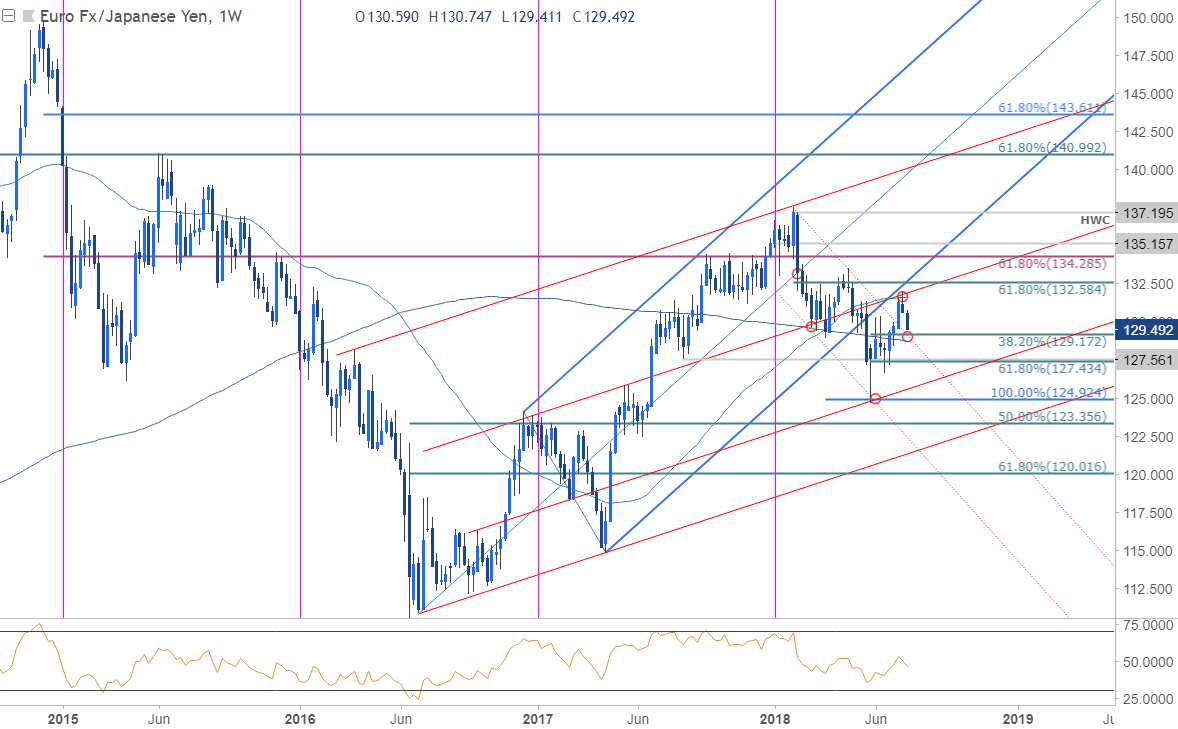
Notes: EUR/JPY reversed off confluence resistance last week near the 132-handle where 52-week moving average converges on basic slope resistance. The pullback is now approaching a key support zone 128.80-129.17 – a region defined by the long 200-week moving average, the 38.2% retracement[5]of the May advance and former channel resistance. Resistance remains steady at 132 with bearish invalidation set to the 61.8% retracement at 132.58.
For a complete breakdown of Michael’s trading strategy, review his Foundations of Technical Analysis series on Building a Trading Strategy[6]
Bottom line: EUR/JPY reversed from confluence up-trend resistance last week and although the immediate focus is lower, we’re looking for possible exhaustion / support on a move into 128.80-129.17. From a trading standpoint, look to reduce short-exposure there and be on the lookout for possible long-entries. There’s no
