
Gold Talking Points
Gold prices[1] continue to carve a series of lower highs & lows ahead of the weekend, with the precious metal at risk of making a run at the July 2017-low ($1205) as recent developments in the Relative Strength Index (RSI) suggest the bearish momentum is gathering pace.
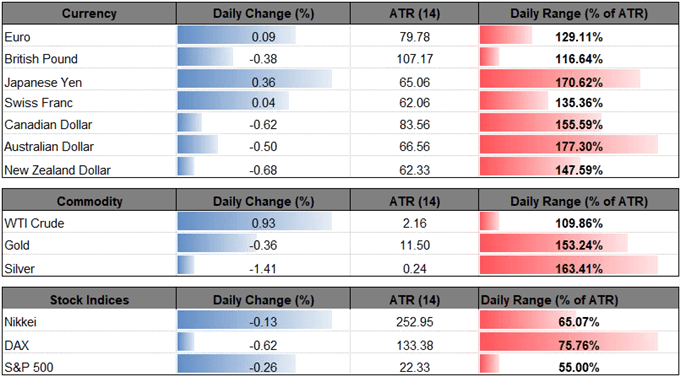
Gold Prices Eye July 2017-Low as RSI Pushes Into Overbought Territory

Gold remains under pressure after clearing the December-low ($1236), and bullion may continue to trade to fresh 2018 lows as retail traders remain net-long the precious metal.
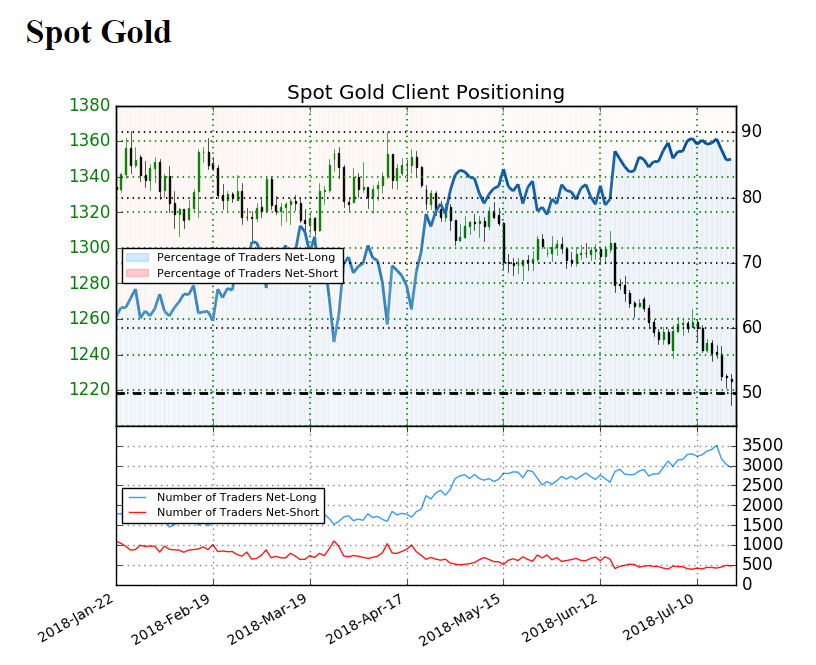
Compared to the 85.8% reading from the previous day, the IG Client Sentiment Report[2] shows 86.1% of traders are now net-long gold, with the ratio of traders long to short at 6.22 to 1.The number of traders net-long is 1.4% lower than yesterday and 12.8% lower from last week, while the number of traders net-short is 14.0% lower than yesterday and 4.9% higher from last week.
Even though net-short interest has shown a small increase from the previous week, the ongoing skew in retail positioning continues to offer a contrarian view to crowd sentiment, with bullion at risk for further losses as long as traders remain heavily net-long gold.
With that said, the broader for gold remains tilted to the downside as both price and the Relative Strength Index (RSI) continue to track the bearish trends from earlier this year, and recent price action warns keeps the downside targets on the radar as gold extends the string of lower highs & lows form earlier this week, while the momentum indicator appears to be pushing deeper into oversold territory.
Gold Daily Chart
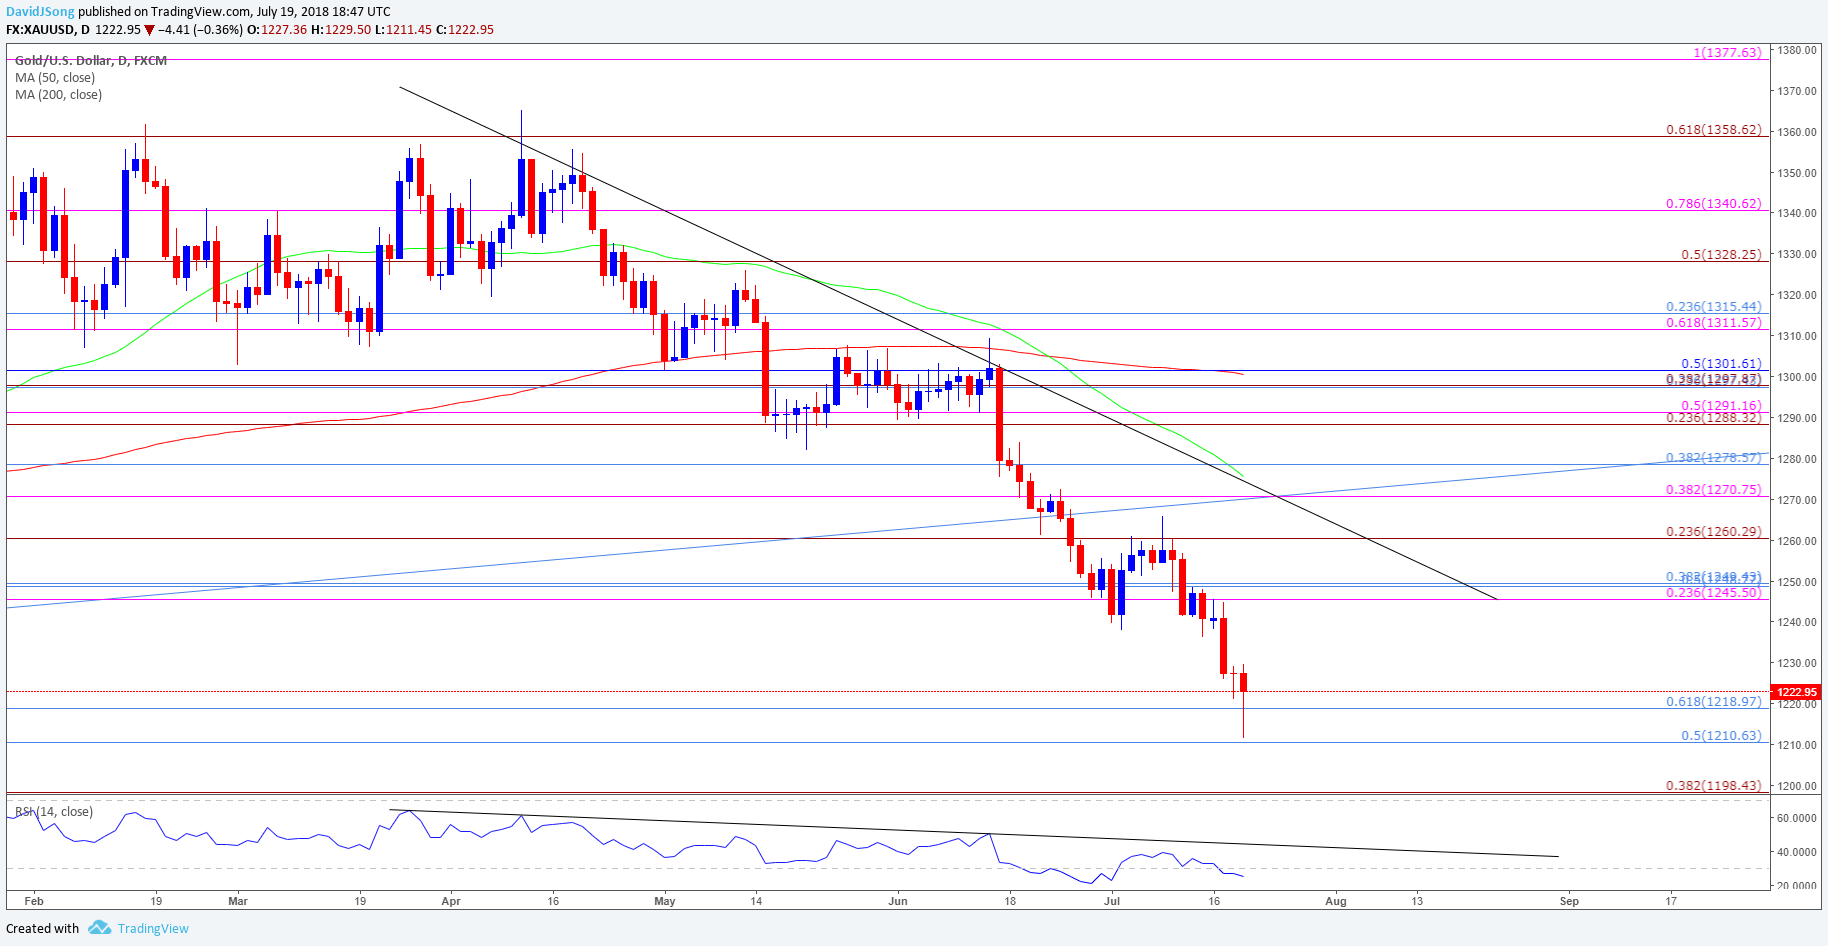
- Gold prices remain vulnerable as the
