
The Japanese Yen has remained on the defensive since the start of the month with USD/JPY[1] trading just pips shy of the yearly highs. Here are the updated targets and invalidation levels that matter for USD/JPY heading into the close of the week. Review this week’s Strategy Webinar[2] for an in-depth breakdown of this setup and more.
USD/JPY Daily Price Chart

Technical Outlook: In my latest Weekly Technical Perspective on the Japanese Yen[3], we highlighted that price had broken above a critical resistance zone at, “110.88-111.65- a region defined by the 61.8% retracement of the November sell-off and the 50% of the broader decline off the late-2016 high.” Price closed above this threshold last week and leaves the risk for a late-month high in USD/JPY.”
Prices has rallied through yearly open resistance at 112.65 with the advance now trading just below our next key resistance target at 113.27. This level is defined by the 61.8% retracement of the late-2016 decline, the 200-week moving average and pitchfork[4] resistance.
New to Trading? Get started with this Free Beginners Guide[5]
USD/JPY 240min Price Chart
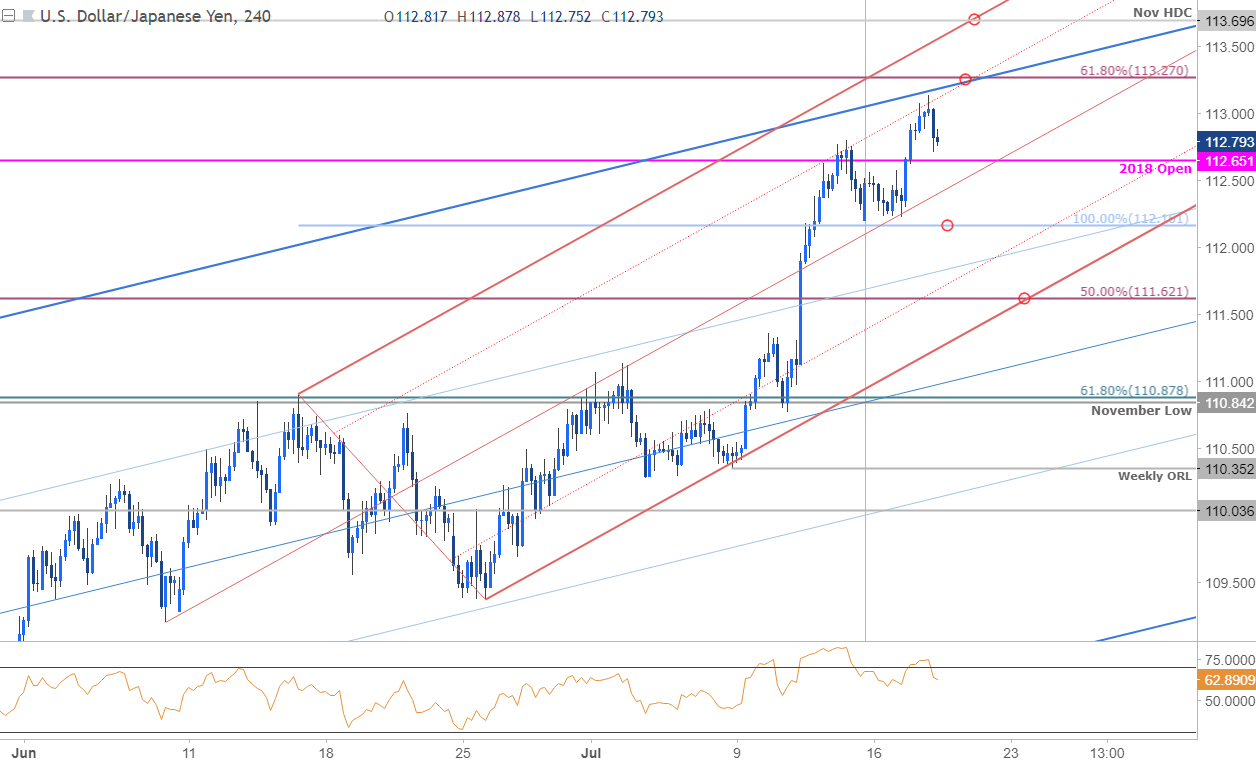
Notes: A closer look at price action sees USD/JPY trading within the confines of an embedded ascending pitchfork formation with the 61.8% line catching the highs over the past two weeks. The broader focus remains constructive while above 111.62 (bullish invalidation) but the advance is vulnerable near-term while below this confluence resistance level. Interim support rests along the median-line (~112.40s) backed by 112.16 and the lower parallel- both areas of interest for possible exhaustion / long-entries IF reached. A
