
The Japanese Yen has fallen (USD/JPY up) nearly 3% from the May extremes with the price now approaching an area of technical significance. These are the updated intraday targets & invalidations levels that matter on the USD/JPY price charts.Review this week’s Strategy Webinar[1] for an in-depth breakdown of this setup and more.
USD/JPY Daily Price Chart
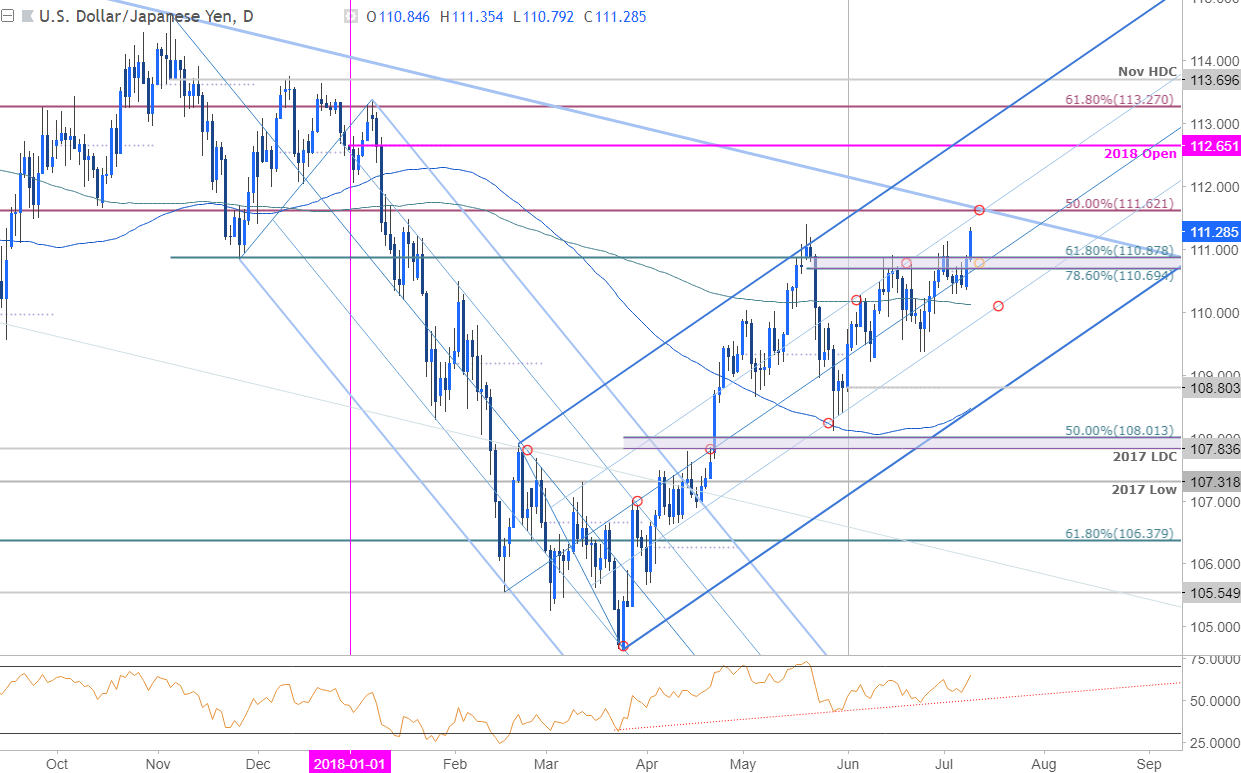
Technical Outlook: In last week’s Technical Perspective on the Japanese Yen[2], we noted that USD/JPY had continued to consolidate just below a, “key resistance range at 110.88-111.65- a region defined by the 61.8% retracement of the November sell-off and the 50% of the broader decline off the late-2016 high.” Note that basic slope resistance[3] extending off the 2017 high and the 50-line of the operative ascending pitchfork formation[4] converge on this upper bounds and further highlight the technical significance of this level.
Initial daily support now rests at 110.70 with bullish invalidation now raised to the 200- day moving average / 50-line around ~110. A breach / close above 111.62 would be needed to keep the long-bias viable with such a scenario targeting the 2018 open at 112.65 backed by the 61.38% retracement at 113.27.
New to Forex[5] Trading? Get started with this Free Beginners Guide[6]
USD/JPY 240min Price Chart
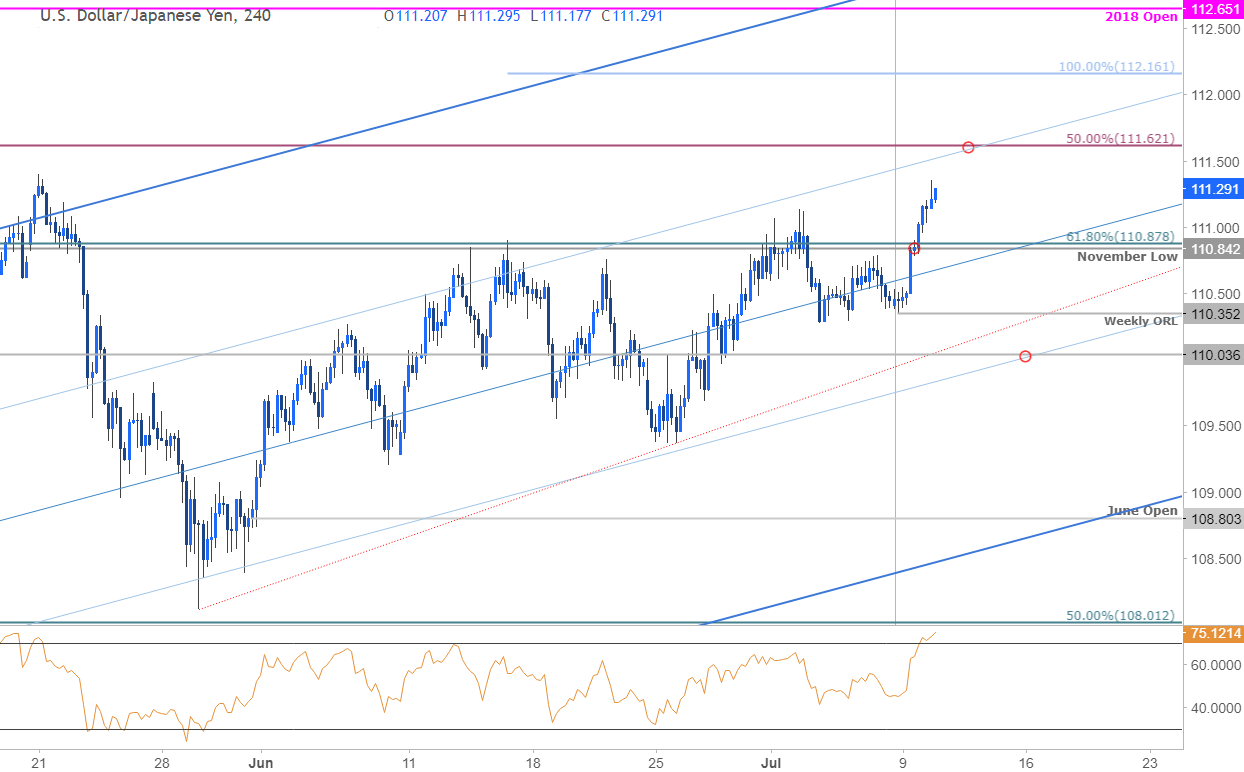
Notes: closer look at USD/JPY price action shows the pair approaching the May highs at 111.40 with intraday RSI deep in overbought territory. The immediate threat remains higher but we’re on the lookout for a reaction on a move into confluence resistance at 111.62 – area of
