
The Australian Dollar responded to key long-term Fibonacci support last week with the recovery now approaching initial resistance objectives. These are the updated intraday targets & invalidations levels that matter on the AUD/USD charts. Review this week’s Strategy Webinar[1] for an in-depth breakdown of this setup and more.
AUD/USD Daily Price Chart
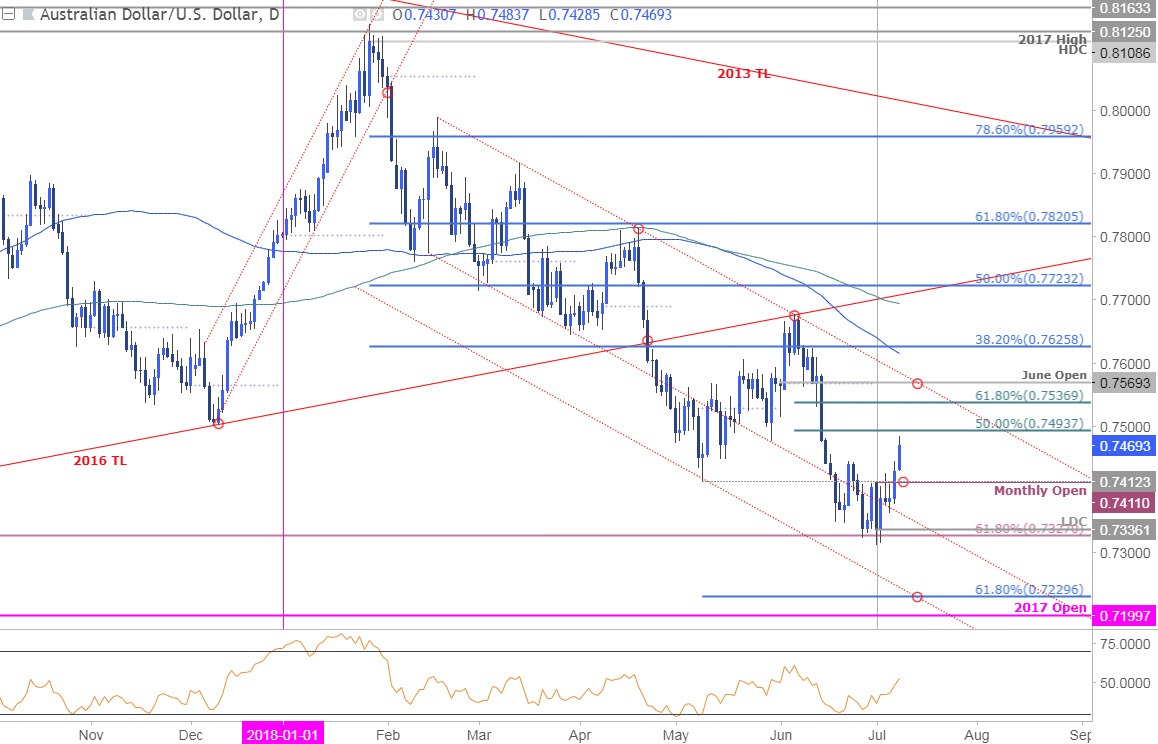
Technical Outlook: In last week’s Technical Perspective on the Australian Dollar[2], we noted that, “Aussie is testing downtrend support here and leaves the broader AUD/USD short-bias vulnerable while above 7327. We’ll be looking for further evidence that an exhaustion low is in place.” Price broke through the initial monthly opening-range[3] highs on building bullish divergence late-last week with the Aussie rallying more than 2.3% off the monthly low.
The move keeps the broader focus higher while above the May lows / monthly open support at 7411/12 with daily resistance eyed at 7494 and the 61.8% retracement at 7537. Ultimately a breach above 7569 would be needed to suggest a larger-scale reversal is underway.
New to Forex[4] Trading? Get started with this Free Beginners Guide[5]
AUD/USD 120min Price Chart
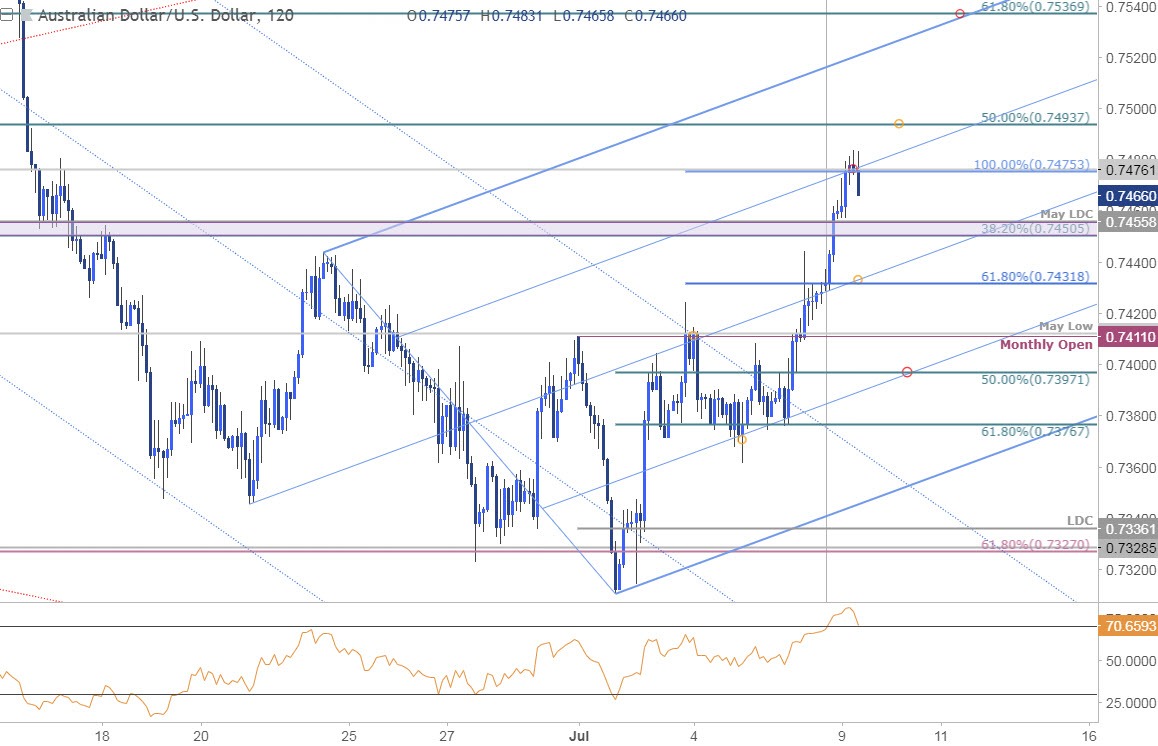
Notes: A closer look at AUD/USD price action shows the pair trading within the confines of a well-defined ascending pitchfork formation[6] extending off the June / July lows with price turning from confluence resistance today at 7476.
Interim support rests at 7450/55 backed by the median-line / weekly open at 7431. I’ll be looking for a reaction there – any lower would risk a drop towards 7411 & our
