
The British Pound posted an outside-day reversal off slope support last week, shifting our near-term focus higher in price. The recovery has now pulled back from the monthly open and IF prices are indeed heading higher, this decline may offer near-term entries on the long-side. These are the updated intraday targets & invalidations levels that matter for GBP/USD.
GBP/USD Daily Price Chart
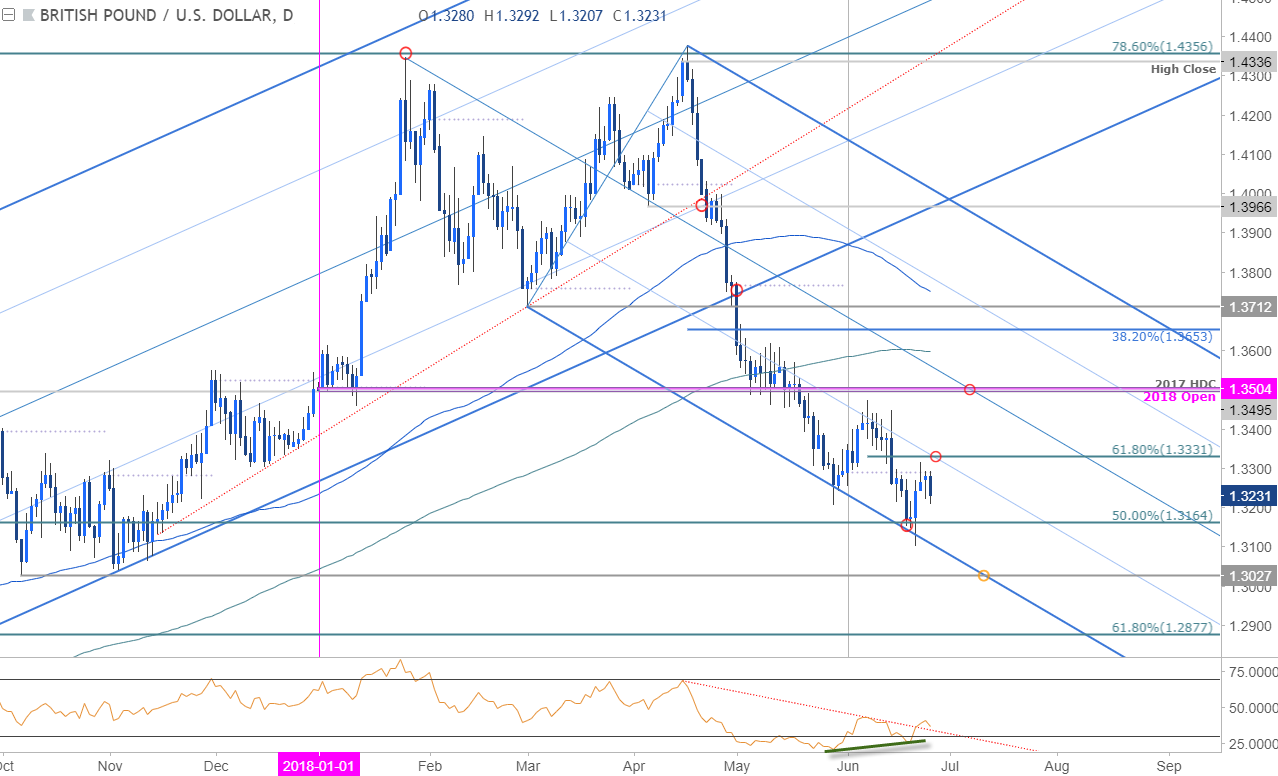
Technical Outlook: In last week’s Technical Perspective on the British Pound[1], we highlighted a confluence support zone in GBP/USD around ~1.3164, “This region is defined by the 50% retracement of the post-Brexit advance and converges on the lower median-line parallel & basic trendline support[2] extending off the 2017 lows.” We noted that IF prices were going to recover- this would be a, “good spot” with daily RSI divergence further highlighting the risk for a near-term recovery.
Sterling rallied more than 1.6% off the lows last week before pulling back from monthly open resistance at 1.3290. A rally surpassing the 61.8% retracement[3] of the monthly range at 1.3330 would be needed to suggest a more significant low is in place and validate a breakout with such a scenario targeting confluence resistance into the 1.35-handle. A downside break of this range keeps the broader short-bias in play targeting the lower parallel / October low at 1.3027.
New to Forex[4] Trading? Get started with this Free Beginners Guide[5]
GBP/USD 240min Price Chart
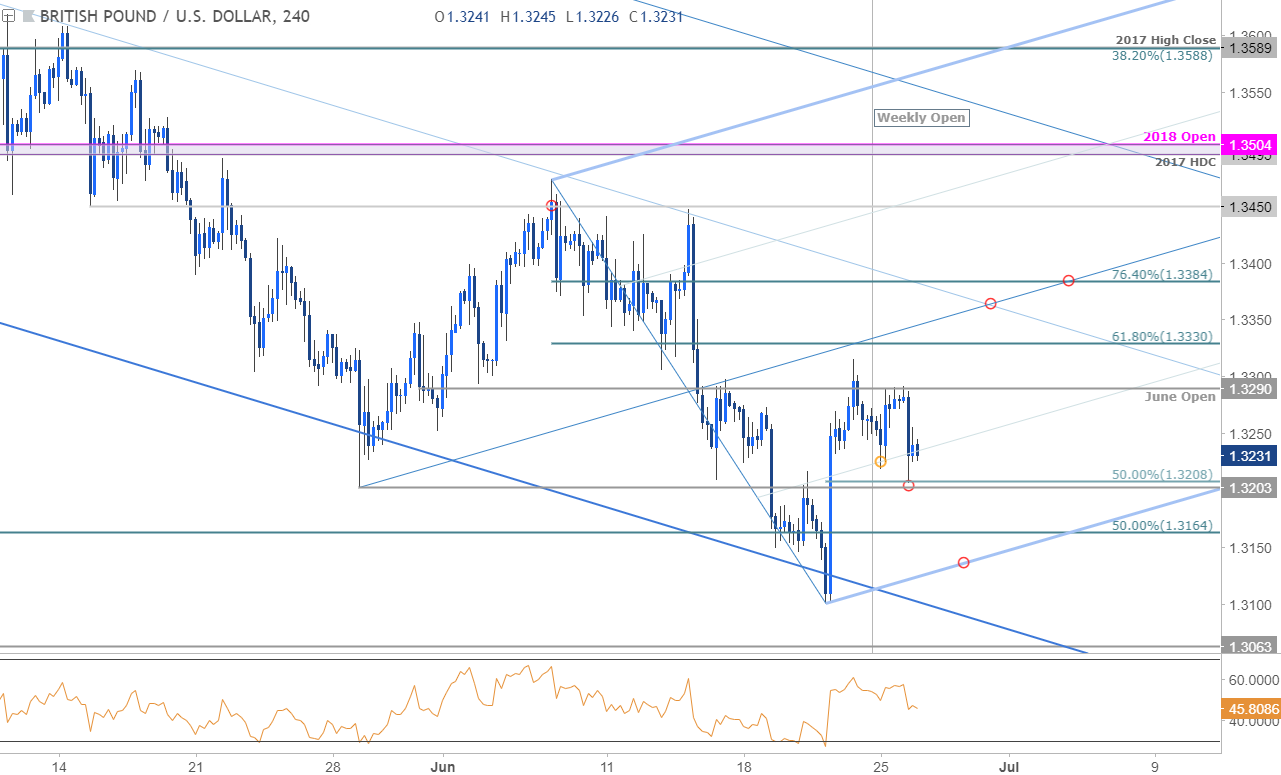
Notes: A closer look at Sterling price action highlights last week’s reversal off descending pitchfork support[6] with price closing just below the monthly open at 1.3290- note
