
Take a look at the WTI and Brent crude oil[1] prices after OPEC
IG analyst, Shaun Murison, takes a look at the Brent and WTI crude oil price charts in the wake of the decision by OPEC and some non-OPEC oil producers to raise output by 1 million barrels a day.
Oil markets react to news of production increase
Oil markets have reacted to the news that the Organisation of the Petroleum Exporting Countries (OPEC) and non-OPEC nations will look to increase output by one million barrels per day (bpd). Initial gains in crude oil prices were perhaps a result of the announced increase falling below levels previously suggested by Saudi Arabia and Russia. Those countries had suggested an increase of 1.5 million bpd.
Comments from OPEC producers Iran and Iraq suggest that the output increase may fall short of the one million bpd target and may only realize a range of 500,000 to 770,000 bpd, as some countries would find difficulty in hitting the new quotas.
The US crude benchmark, WTI[2], rose more than 5% in the immediate aftermath of the increase announcement. The Brent[3] crude benchmark managed to add 3.5% on the day. The gains were then paired.
Trade idea based on relationship between Brent and WTI crude oil benchmarks
Rather than looking at trading a purely one direction bias in the oil markets, the relationship between WTI and Brent might be deviating enough to offer a market neutral or pair trading opportunity.
The below chart looks to help identify this potential opportunity.
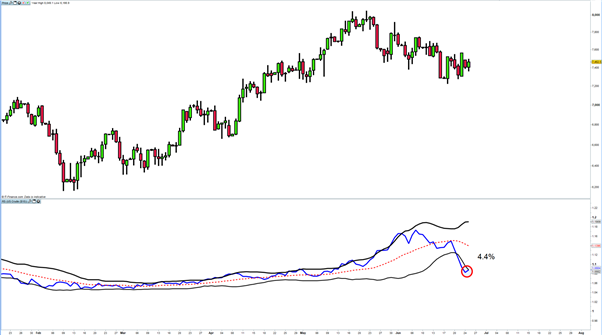
Brent Crude vs US Crude (WTI)
The chart is the Brent candlestick
