
The Australian Dollar has traded within a nearly 4% range against the Japanese Yen since the start of May trade with the AUD/JPY pullback from a key resistance range last week risking further losses. Here are the levels that matter as we head into major event risk later this week.
AUD/JPY Daily Price Chart
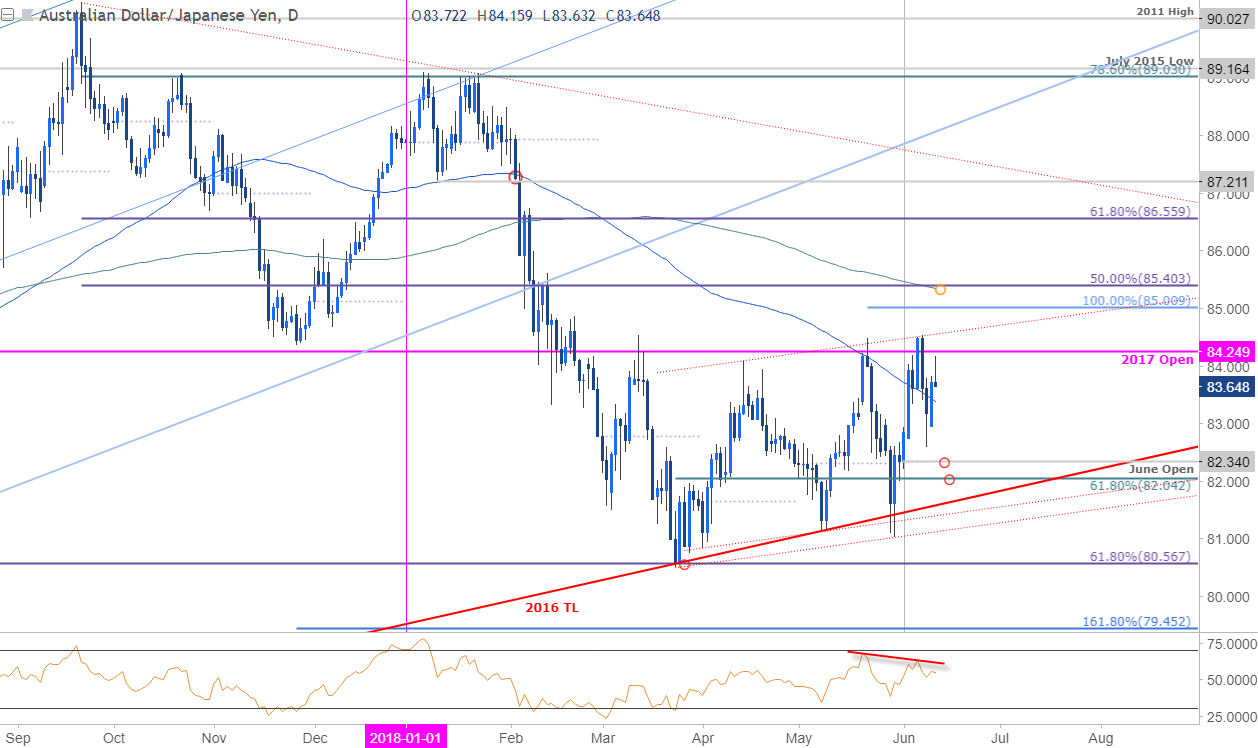
Technical Outlook:In this week’s Technical Perspective on AUD/JPY[1], we highlighted a well-defined price range on the weekly charts while noting that, “from a trading standpoint, I’ll favor fading strength near-term but respect this range with a weekly close needed to validate a break on either side.” The daily chart shows price trading within a shallow ascending channel formation with daily RSI[2] marking strong bearish divergence into the monthly high. The focus remains on this turn from the range-highs with the near-term risk lower while below 84.25.
Initial daily support rests with the monthly open at 82.34 backed closely by the 61.8% retracement of the March advance at 82.04. Ultimately a break / close below the lower parallels would be needed to mark resumption of the broader down-trend. A topside breach of the monthly opening-range[3] highs shifts the focus towards subsequent resistance objectives at the 85-handle backed by the 200-day moving average / 50% retracement at 85.35/40.
New to Forex[4] Trading? Get started with this Free Beginners Guide[5]
AUD/JPY 120min Price Chart
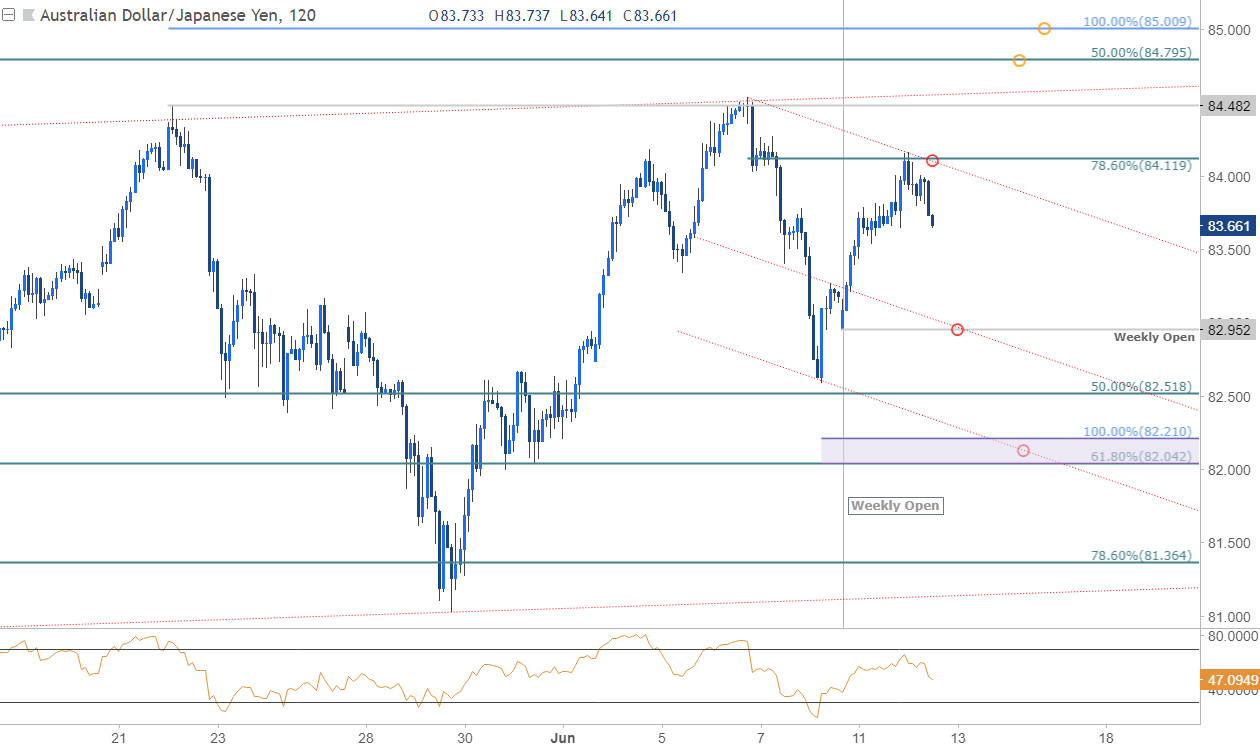
Notes: A closer look at AUD/JPY price action sees the pair turning from Fibonacci[6] resistance today at 84.12 with an outside-reversal bar off the highs shifting the near-term focus
