
The Japanese Yen[1] is weaker against all its major counterparts month-to-date with USD/JPY up nearly 2% off the May low. The rally is now testing confluence resistance and may cap further price advances in the near-term. Here are the USD/JPY levels that matter heading into the close of the week.
USD/JPY Daily Price Chart
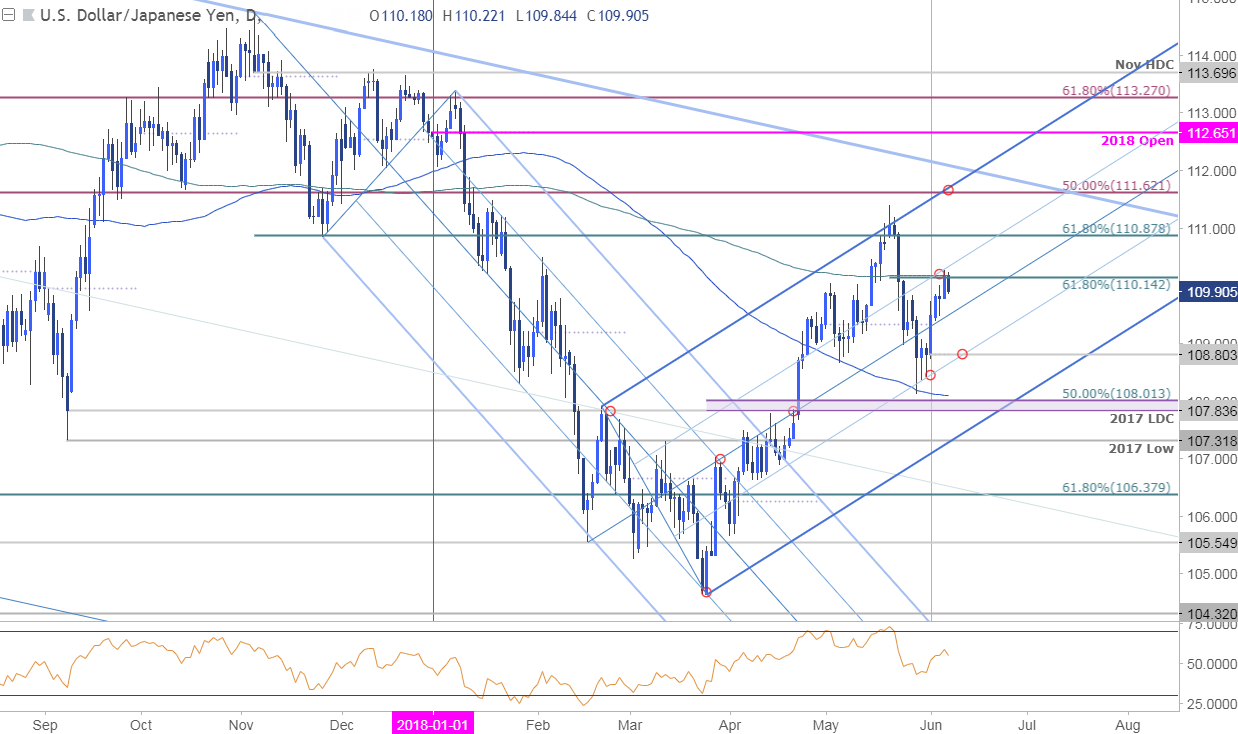
Technical Outlook: In this week’s Technical Perspective on the Japanese Yen[2], we highlighted the USD/JPY price reversal off a key resistance range last month while noting that the advance was, “at risk in the medium-term while below 111.65. We can’t rule out another test of the highs but IF price is heading lower on this stretch, look for initial resistance at the 52-week / 200-day moving averages at ~110.15/30s.”
Price registered a high at 110.27 on building RSI divergence[3] last night before pulling back- Its decision time. Look for daily support along the median-line backed by the monthly open at 108.80 with broader bullish invalidation down at the 2017 low-day close / 50% retracement at 107.84-108.01. A breach above this threshold targets the confluence resistance at the May high-day close / 61.8% retracement at 110.88-111.04 backed by 111.62.
New to Forex[4] Trading? Get started with this Free Beginners Guide[5]
USD/JPY 240min Price Chart
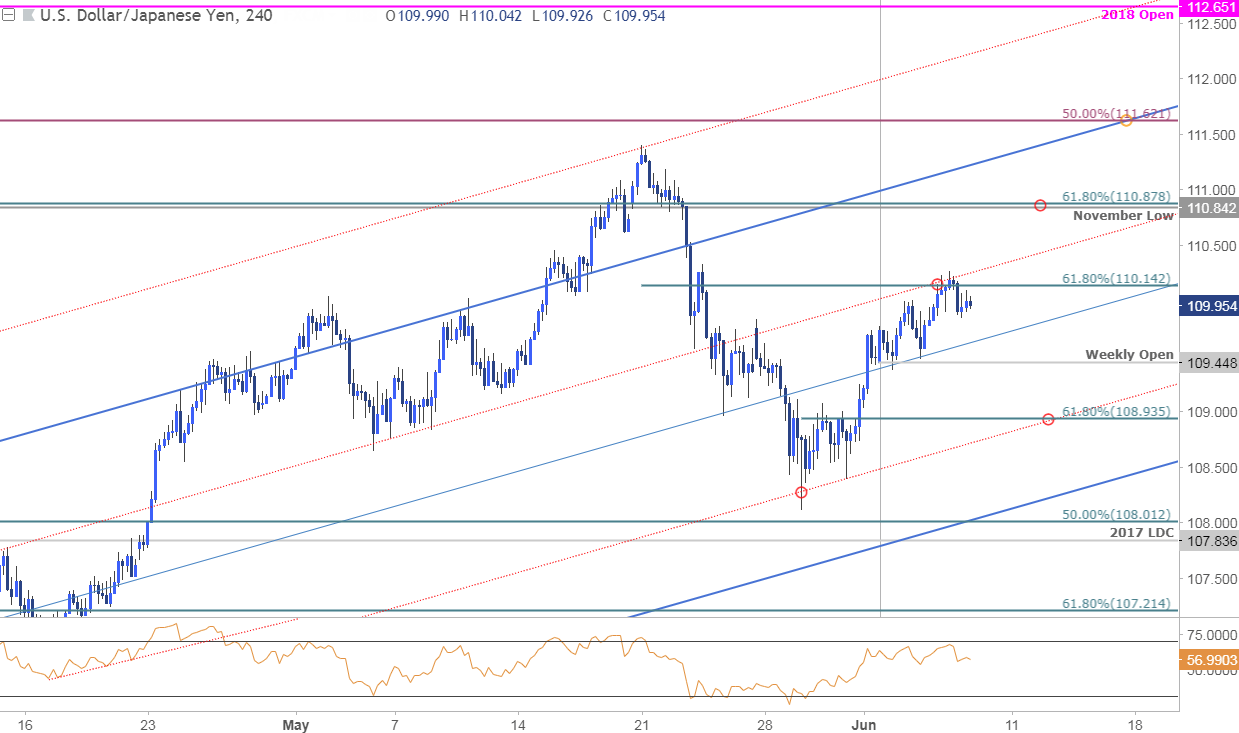
Notes: I’m working with a slightly different slope on the USD/JPY intraday chart, but the horizontal price targets are the same. Initial support rests at the median-line[6] with a break below the weekly open at 109.45 needed to validate a near-term reversal targeting 108.94
