
In this series we scale-back and take a look at the broader technical picture to gain a bit more perspective on where we are in trend. Here are the key levels that matter on the weekly charts for the US Dollar (DXY). Review this week’s Strategy Webinar[1] for an in-depth breakdown of this setup and more.
New to Trading? Get started with this Free Beginners Guide[2]
DXY Weekly Price Chart
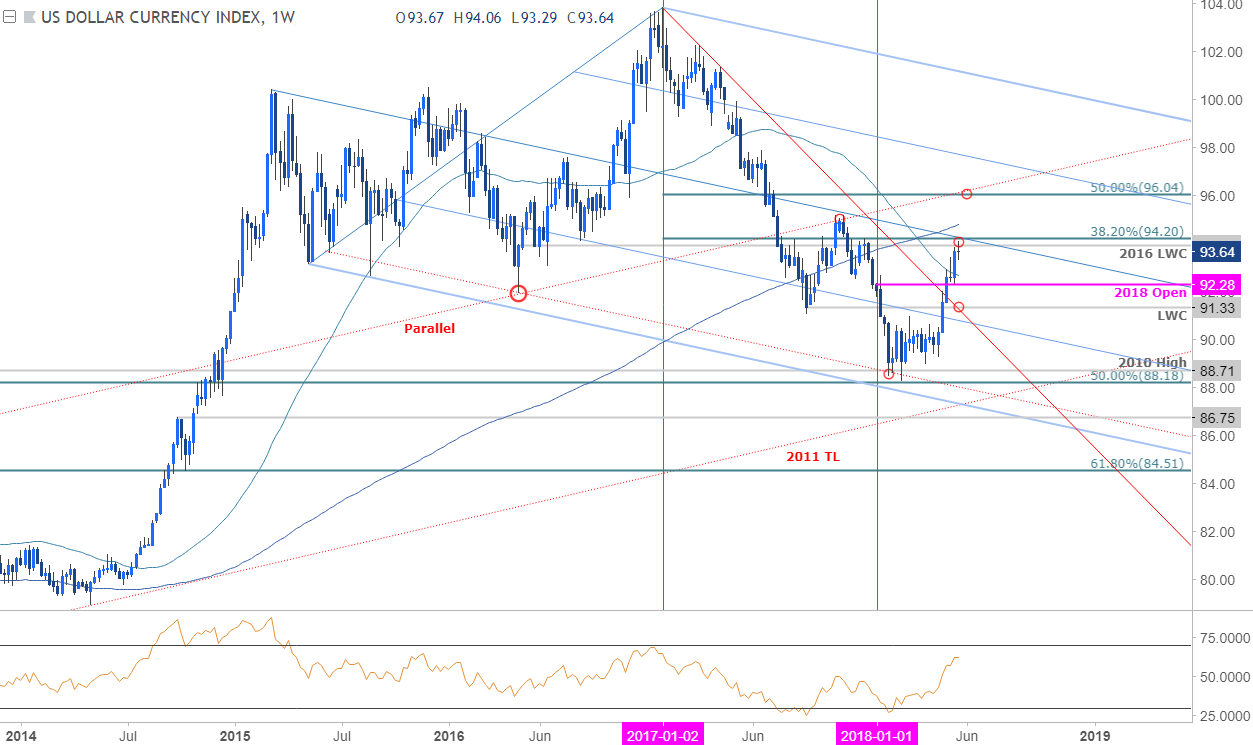
Notes: The US Dollar Index (DXY) has continued to trade within the confines of a broad descending pitchfork formation[3] extending off the 2015 & 2017 swing highs with price registering the yearly lows at the lower parallels earlier this year. The subsequent rebound is testing confluence resistance this week at 93.89-94.20 where the 2016 low-week reversal close and the 38.2% retracement of the 2017 decline converge on the median-line.
For a complete breakdown of Michael’s trading strategy, review his Foundations of Technical Analysis series on Building a Trading Strategy[4]
Bottom line: The broader long-bias remains at risk near-term while below this threshold. Interim support rests at 92.28 backed by bullish invalidation at 91.33 – both levels of interest for exhaustion / long-entries IF reached. A breach above this key zone targets subsequent resistance targets at the 200-week moving average at 94.80 and the 50% retracement at 96.04. With Euro[5] accounting for nearly 60% of this index, we’ll be looking for near-term opportunities in EUR/USD[6] as outlined in today’s EUR/USD Scalp Report[7].
Why does the average trader
