
Euro has plummeted more than 6% off the yearly highs with the decline now testing an area of confluent support which could offer a near-term reprieve to the recent sell-off. That said, the focus is on a break of the 1.1709-1.1827 range for guidance with the broader downside bias at risk near-term.
EUR/USD Daily Price Chart
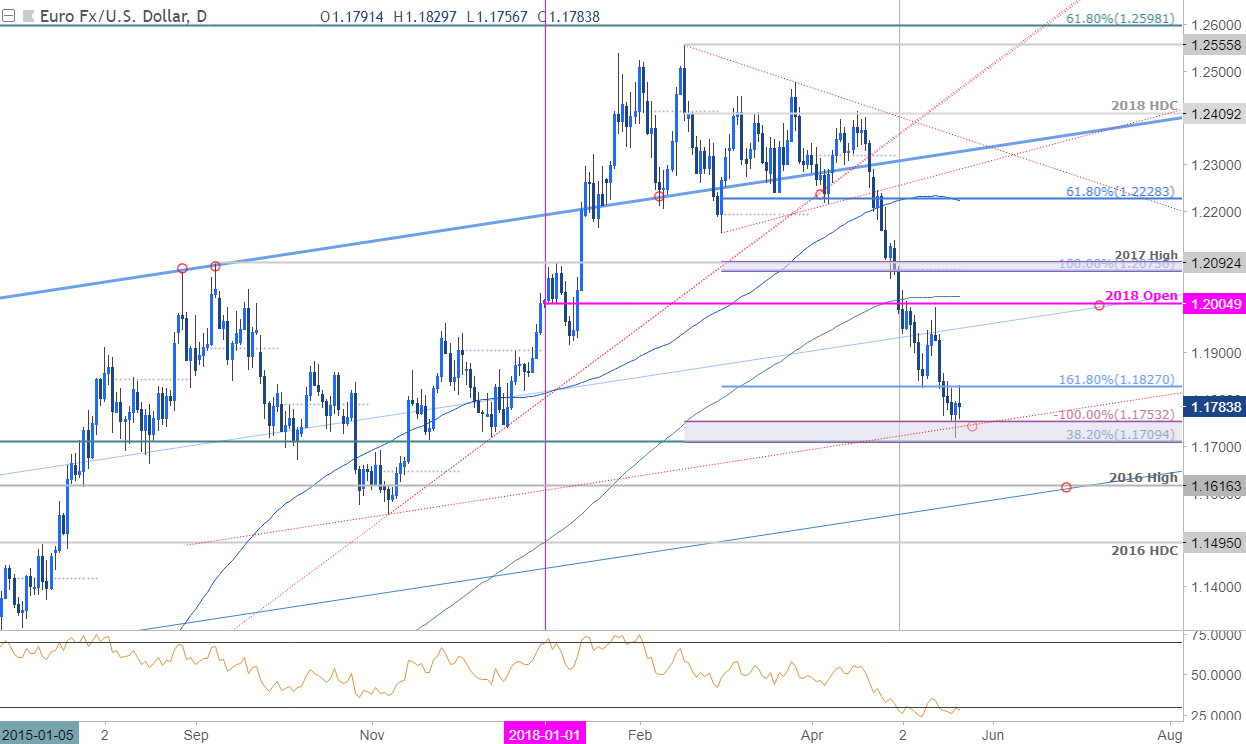
Technical Outlook: In last week’s Euro Technical Perspective[1] we noted that, “The immediate EUR/USD decline is at risk” as price was, “approaching confluence support around 1.1709/45 where the 38.2% retracement of the late-2016 advance converges on a parallel of the dominant slope[2] extending of the November low.” Price registered a low yesterday at 1.1717 before rebounding higher on building momentum divergence and highlights the near-term threat for a larger recovery.
Initial resistance is eyed at 1.1827 and a daily close above this threshold (with and RSI[3] recovery above 30) would suggest a more significant low may be in place. A break lower from here invalidates the reversal play with such a scenario targeting the 2016 high at 1.1616 backed closely by median-line support[4].
New to Forex[5] Trading? Get started with this Free Beginners Guide[6]
EUR/USD 240min Price Chart
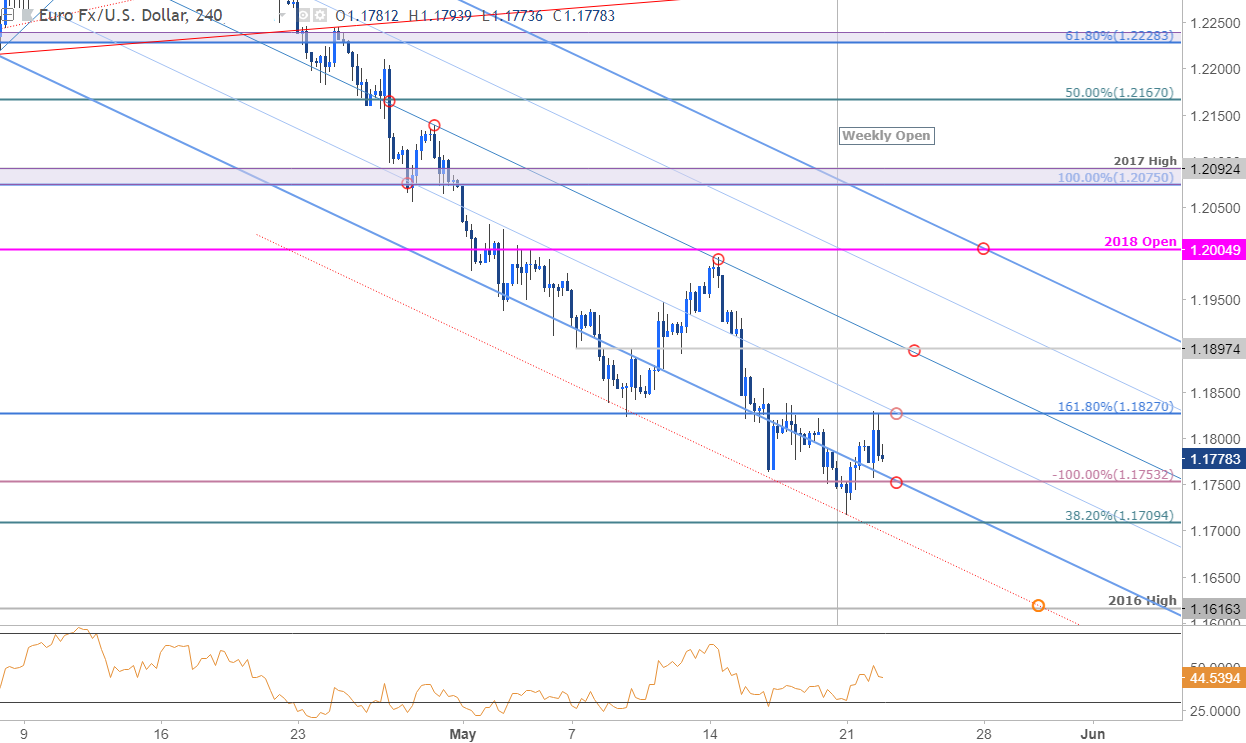
Notes: A closer look at Euro price action sees the pair trading within the confines of descending pitchfork formation with price rebounding off parallel support extending off the 5/8 low (red). Note that the drop into 1.1753 achieves the broader measured objective of the February – April consolidation break and IF price is going to rebound, this would be a good
