
In this series we scale-back and take a look at the broader technical picture to gain a bit more perspective on where we are in trend. Here are the key levels that matter on the weekly charts for the Australian Dollar[1]. Review this week’s Strategy Webinar[2] for an in-depth breakdown of this setup and more.
New to Trading? Get started with this Free Beginners Guide[3]
AUD/USD Weekly Price Chart
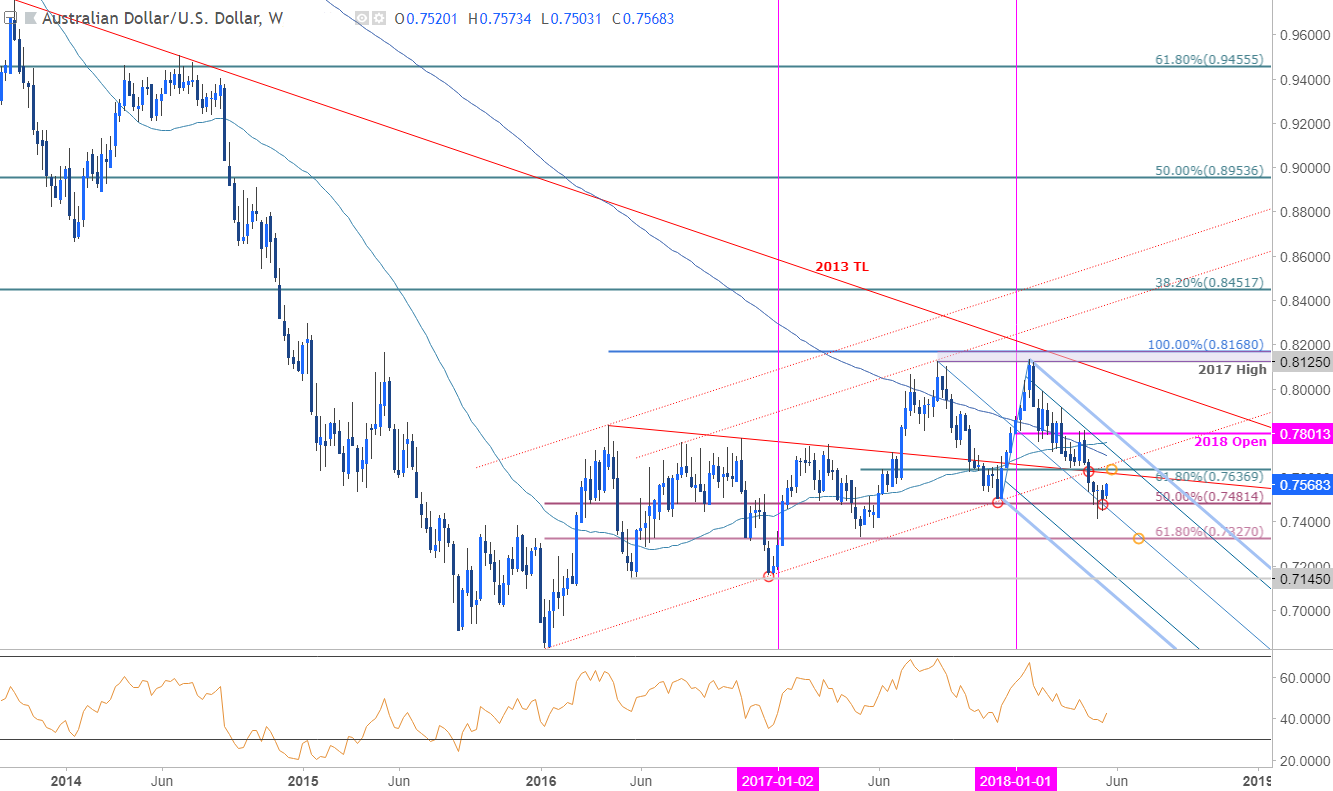
Notes: Last week we noted that the Australian Dollar was, “testing BIG weekly support[4] and IF price is going to rebound, this would be a good spot.” Price was unable to close below confluence support at 7480 with Aussie mounting a counter-offensive against the US Dollar[5] early in the week. Note that the momentum profile looks similar to that of the late-2017 rebound and further highlights the risk for topside gains near-term - but stay nimble; the broader outlook remains tilted to the downside while within this descending pitchfork formation[6].
Bottom line: Look for initial resistance up towards 7636- a breach there would be needed to suggest that a larger reversal is underway / a more significant low is in place. A weekly close below 7480 would mark resumption for the broader downtrend with such a scenario targeting 7327. As noted in today’s webinar, for now, I’m willing to trade the long-side targeting slope resistance[7].
For a complete breakdown of Michael’s trading strategy, review his Foundations of Technical Analysis series on Building a Trading Strategy[8]
