
The Australian Dollar[1] has continued to trade within a 2% range (150pips) since the start of May trade with price setting a well-defined monthly opening-range just above weekly support. While the broader risk remains weighted to the downside, the immediate bias remains vulnerable near-term while above this week’s lows. Here are the levels that matter for AUD/USD heading into the close of the week.
AUD/USD Daily Price Chart
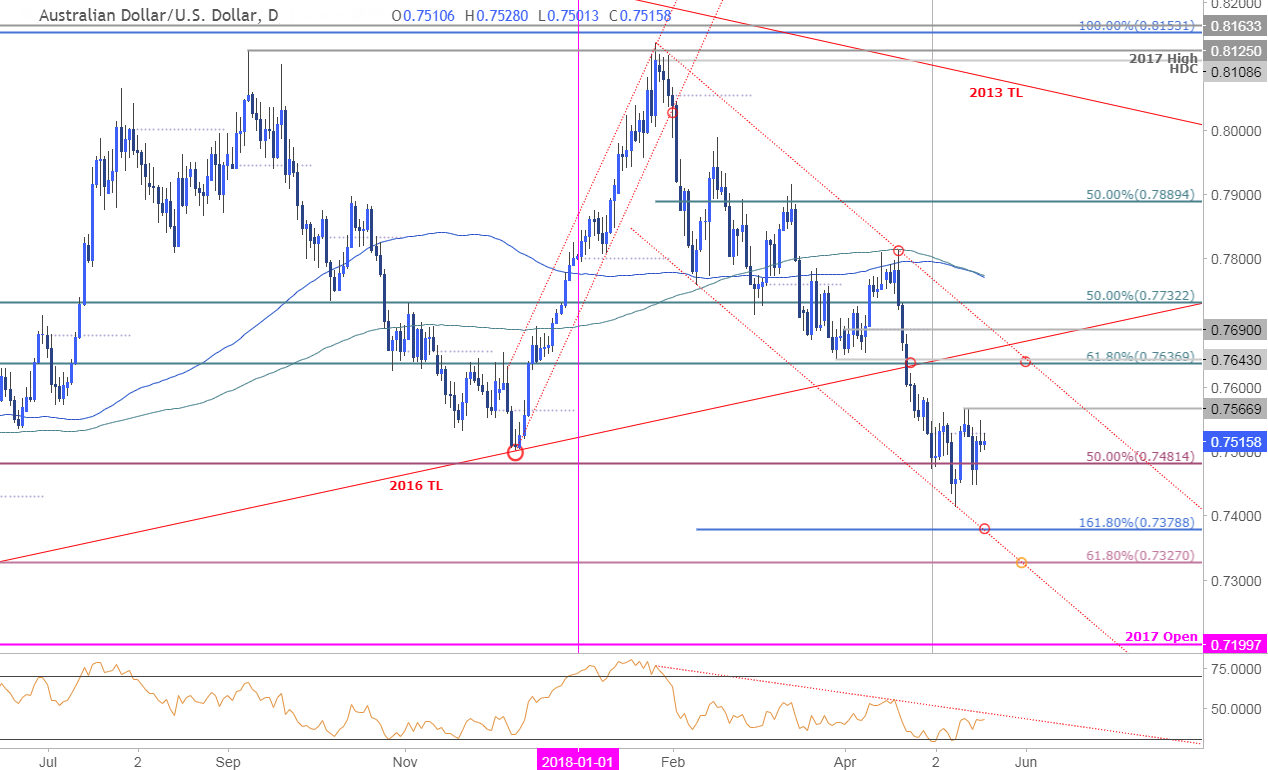
Technical Outlook: In last month’s Weekly Technical Perspective[2] we highlighted that a break of support in the Aussie left the, “near-term risk lower in price while below 7635. Subsequent support objectives are eye at the median-line / 50% retracement of the 2016 advance at 7480-7500.” Price is trading in this range now after registering a low at 7412 last week. Note that AUD/USD posted a weekly Doji[3] off this support zone and the immediate downside bias remains vulnerable while above 7480 on a weekly close basis.
The daily chart is a bit messy here but the focus is on a break of the well-defined May opening-range[4] to offer guidance. Initial resistance is eyed at 7567 with bearish invalidation steady at 7635. A break lower from here targets 7379 backed by the 61.8% retracement of the 2016 advance at 7327.
New to Forex[5] Trading? Get started with this Free Beginners Guide[6]
AUD/USD 240min Price Chart
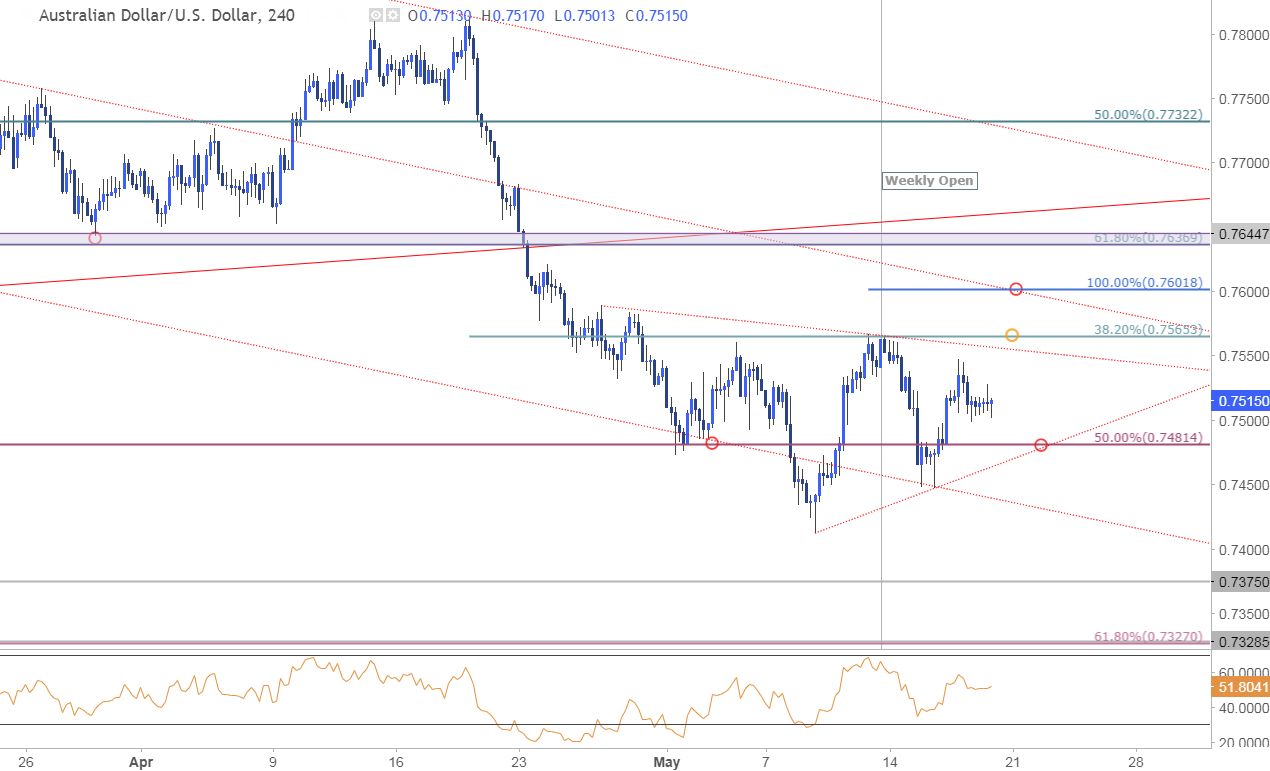
Notes: A closer look at price action sees the Australian dollar consolidating just above the 7480 support zone- look for a break of this pattern. A topside breach risks a correction
