
GOLD & CRUDE OIL TALKING POINTS:
- Gold prices[1] stall just shy of breaking critical support line
- Crude oil price[2] chart continues to show signs of topping
- Bare economic calendar might boost headline sensitivity
Commodity prices corrected higher amid a broad-based retracement of Tuesday’s price action[3] across benchmark asset classes. Gold prices edged up as the US Dollar[4] retreated after setting a fresh four-month high, boosting the appeal of anti-fiat alternatives. Meanwhile, crude oil prices followed the bellwether S&P 500[5] stock index upward.
BARE CALENDAR MAY BOOST HEADLINE SENSITIVITY
Looking ahead, a lull in top-tier scheduled event risk might make for a day of consolidation. Crude oil might see a bit of knee-jerk volatility as June WTI options expire. The absence of a clear catalyst might make for elevated sensitivity to stray headline risk however, so traders would be wise to proceed with caution.
See our quarterly gold price forecast[6] to learn what will drive the trend through mid-year!
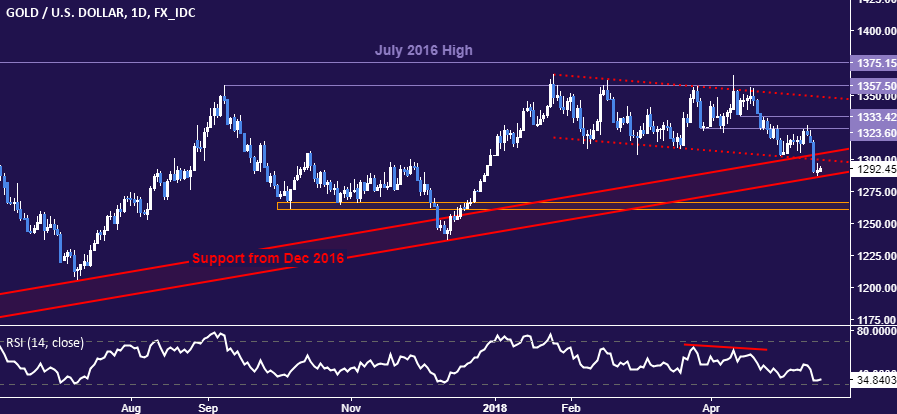
GOLD TECHNICAL ANALYSIS
Gold prices continue to test the outer layer of support guiding them higher since December 2016, now at 1286.55. A daily close below that exposes the 1260.80-66.44 area. Alternatively, a push back above 1304.32 opens the door for a retest of support-turned-resistance in the 1323.60-33.42 zone.
CRUDE OIL TECHNICAL ANALYSIS
A bearish Evening Star candlestick pattern coupled with negative RSI divergence continue to hint that a top is in the works. A turn back below resistance-turned-support at 69.53 exposes the 66.22-67.36 area anew. Alternatively, a daily close above the May 10 high at 71.86
