
Talking Points:
- A stronger US Dollar[1] on the back of higher US Treasury yields (both nominal and real) has paved the way for lower Gold prices[2]. - Gold’s symmetrical triangle, previously eying topside resolution, has failed and broken to the downside. - Sentiment for the US Dollar[3]has started to turn contrarian bullishmidway though Q2’18. For longer-term technical and fundamental analysis, and to view DailyFX analysts’ top trading ideas for 2018, check out the DailyFX Trading Guides[4] page. Gold prices broke below their March 1 swing low at 1302.68 today, setting up a break to fresh 2018 lows and a break of the symmetrical triangle in place since mid-January all in one fell swoop. Concurrently, the break of the uptrend from the December 2016, July 2017, and March 2018 has now definitely broken to the downside, after the failed return to the trendline last week. Now, bearish momentum is accelerating, with Gold prices below their daily 8-, 13-, and 21-EMAs, and both MACD and Slow Stochastics trending lower in bearish territory. Gold Price: Daily Timeframe (September 2016 to April 2018) (Chart 1)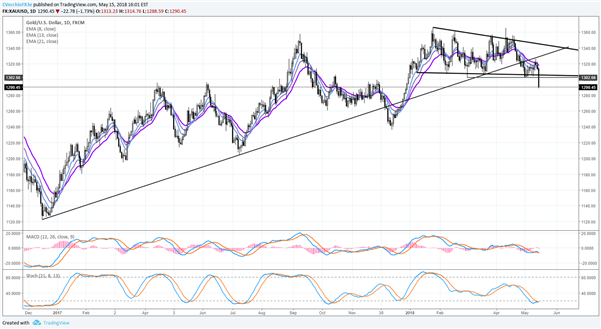 What has been the catalyst to this break lower by bullion? A stronger US Dollar on the back of higher US Treasury yields (both nominal and real) has paved the way for lower Gold prices. Gold Price versus US Real 10-year Yield: Daily Timeframe (May 2017 to May 2018) (Chart 2)
 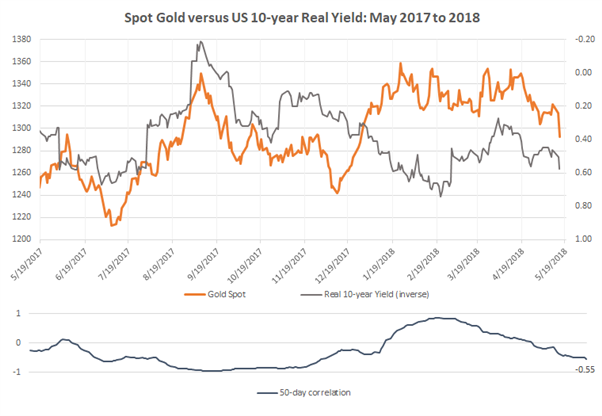 Presently, rising US real yields means that the spread between Treasury yields and inflation rates are increasing
