
In this series we scale-back and take a look at the broader technical picture to gain a bit more perspective on where price is trading with respect to trend. Here are the key technical levels that matter on the weekly charts heading into the May open.
GBP/USD Weekly Chart
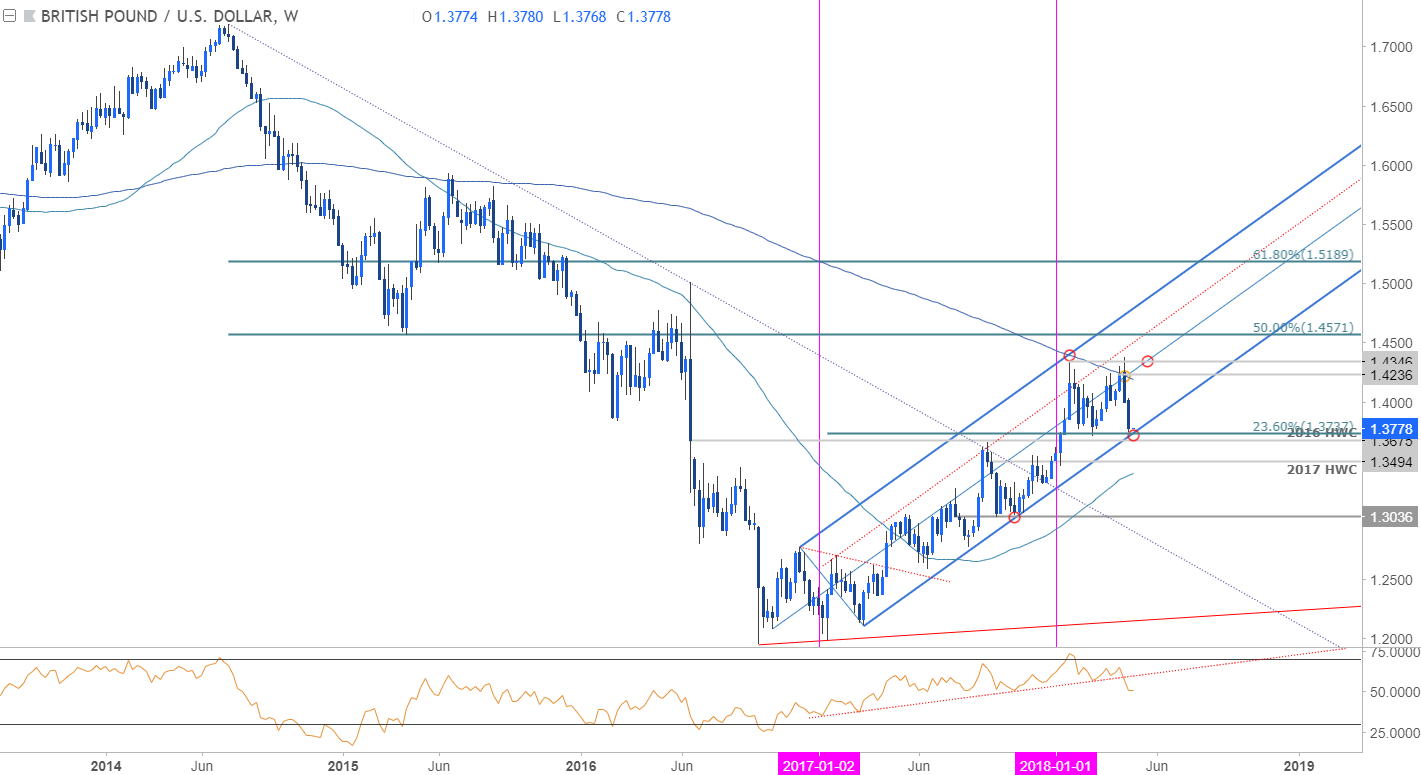
Notes: The British Pound[1] posted an outside-weekly reversal candle[2] off the yearly highs this month with the decline now taking prices towards a critical support confluence at 1.3675-1.3737 – a region defined by the 23.6% retracement of the 2017 advance, the 2016 high-week close (Brexit), and the lower median-line parallel of the longer-term pitchfork formation we’ve been tracking since last year. A weekly close below this threshold would invalidate the broader uptrend in cable with such a scenario targeting the 2017 high-week close at 1.3494.
Bottom line: It’s make-or-break here for the British Pound with the immediate short-bias at risk here while above key longer-term uptrend support. A weekly close below would suggest a larger-scale pullback is underway with such a scenario targeting the 2017 high-week close at 1.3494 backed by the 52-week moving average at ~1.3400.
New to Trading? Get started with this Free Beginners Guide[3]
AUD/USD Weekly Chart
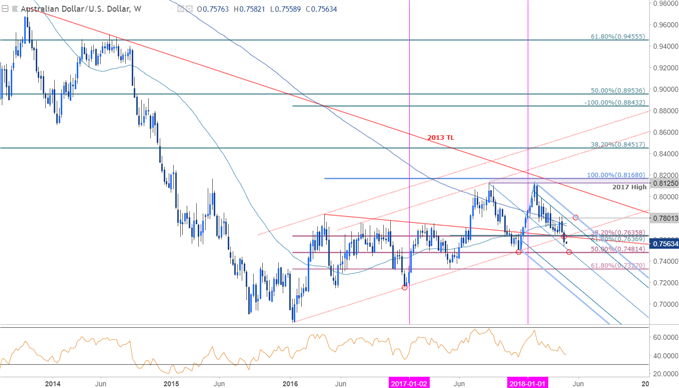
Notes: The Australian Dollar[4] crashed through long-term confluence support last week at 7635 and leaves the near-term risk lower in price while below this threshold. Subsequent support objectives are eye at the median-line / 50% retracement of the 2016 advance at 7480-7500. Broader bearish invalidation stands with the upper parallel / yearly open at 7801.
Bottom line:
