
The British Pound has fallen more than 3% off the yearly highs with the decline taking out the April opening range lows. While the broader outlook does remain constructive, near-term the risk for a pullback in price has us looking for a possible exhaustion lower down near structural support.
GBP/USD Daily Price Chart
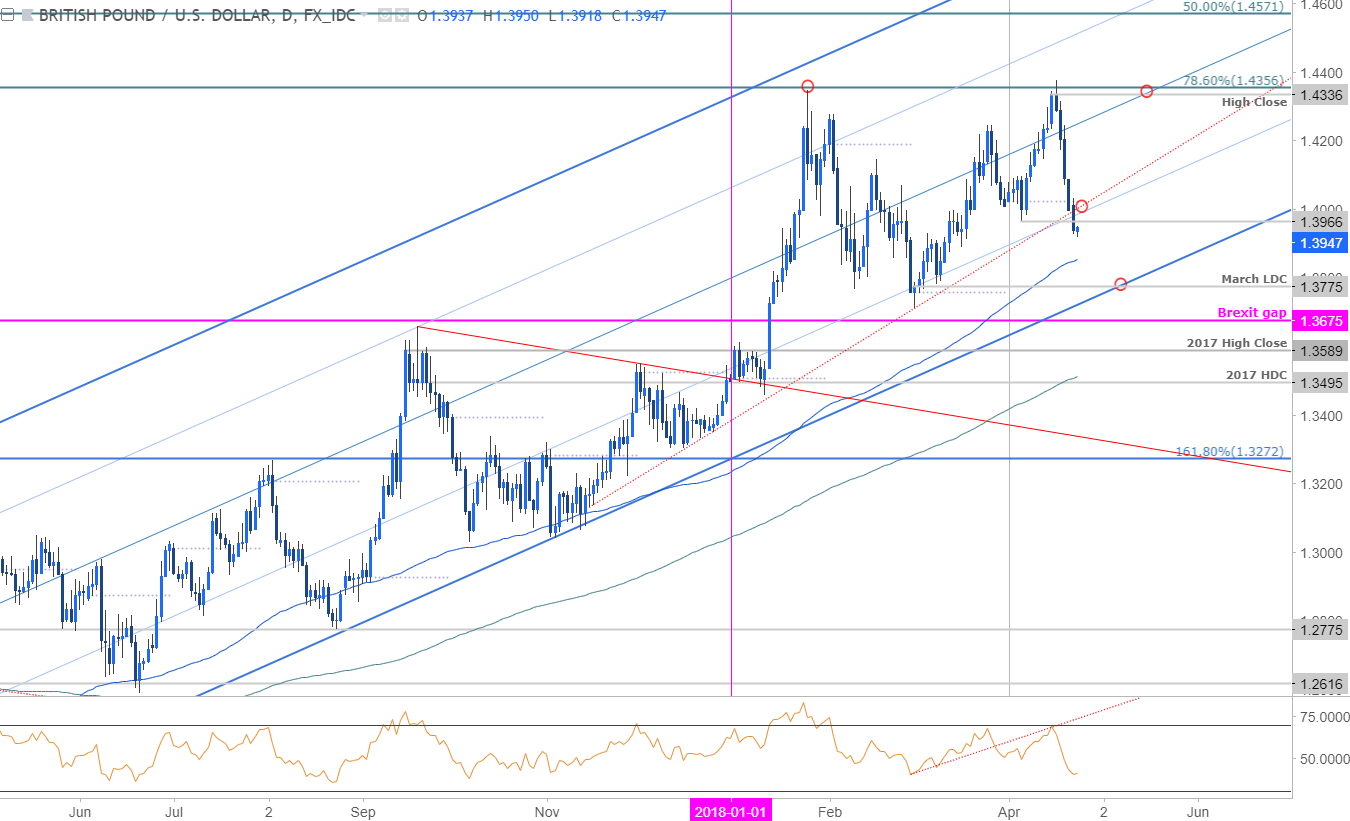
Technical Outlook: In my last Weekly Technical Outlook[1] we noted that Cable was approaching the 2018 highs at 1.4346 with a breach above this threshold needed to keep the broader long-bias in play. Price posted an outside-weekly reversal off this threshold before break below the objective April opening range lows yesterday. The decline also validates a break of the November slope line and leaves the risk lower while below the monthly open at 1.4024.
Note that yesterday’s close marked the fifth consecutive daily decline – three of the last five instances of such an occurrence saw a slight reprieve (a day or so) before registering a new low. That said, look for initial support along the lower parallel.
New to Forex[2] Trading? Get started with this Free Beginners Guide[3]
GBP/USD 240min Price Chart
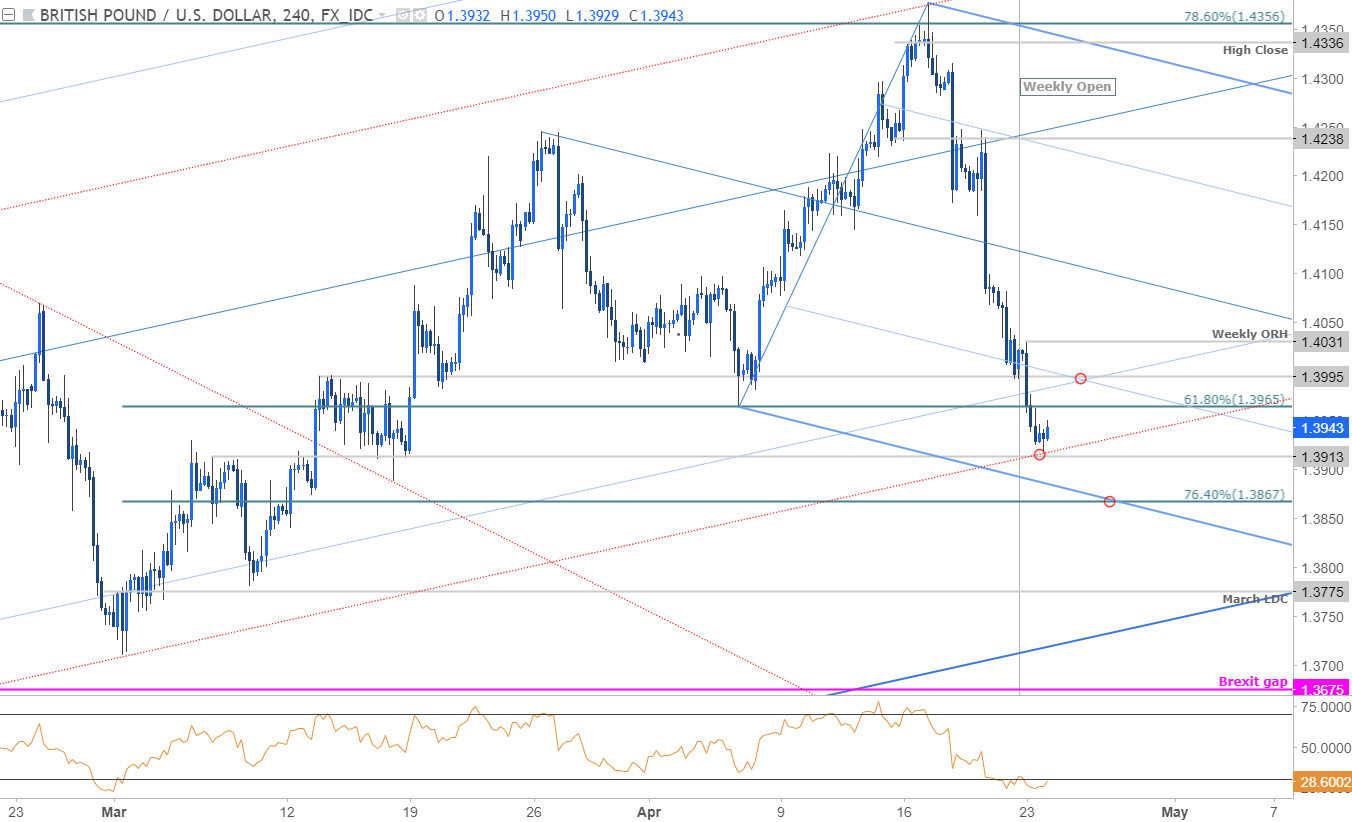
Notes: A closer look at price action sees Cable trading within the confines of a near-term descending pitchfork formation[4] extending off the March highs with this week’s decline slipping below the monthly range lows / 61.8% retracement at 1.3965. IF this break is legit, topside advances should be capped by the weekly highs / monthly open resistance at 1.4024/31. A break lower from here targets the lower parallel / 100-day moving average at 1.3854/67 with broader bullish
