The Australian Dollar[1] has rallied nearly 2% off the yearly lows with prices now eyeing initial resistance hurdles. While the broader outlook does remain constructive, near-term the risk for a pullback in price has us looking for a possible exhaustion pullback to offer more favorable opportunities.
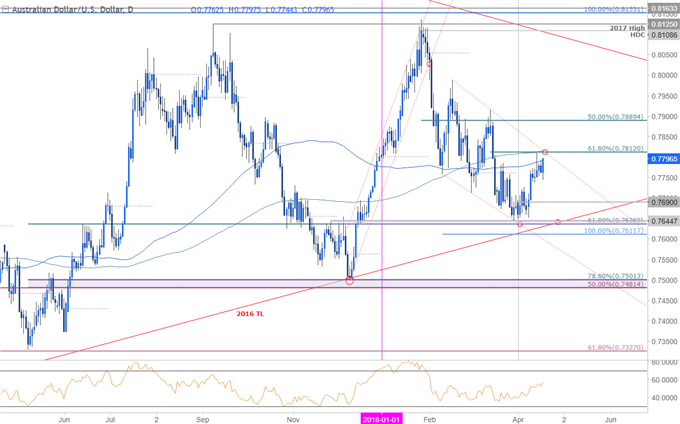
AUD/USD Daily Price Chart

Technical Outlook: Earlier this month we highlighted a critical weekly support confluence in AUDUSD[2] with while noting that, “the immediate short-bias is at risk heading into 7612/37 and from a trading standpoint I’ll be looking for evidence of a near-term low in this range.” Price registered a low at 7643 before rebounding with the advance now targeting initial resistance targets at 7793 (100-day moving average) & 7812/15 where the 61.8% retracement converges on slope resistance and the 200-day moving average.
Note that price is poised to post and outside-day reversal into these resistance targets and while the broader outlook remains weighted to the topside the move does warn of possible near-term exhaustion. Monthly open support rests at 7690 with our broader bullish invalidation steady at 7637/45. A topside breach above basic slope resistance[3] targets a rally towards 7876/89 (March high-day close & 50% retracement).
New to Forex[4] Trading? Get started with this Free Beginners Guide[5]
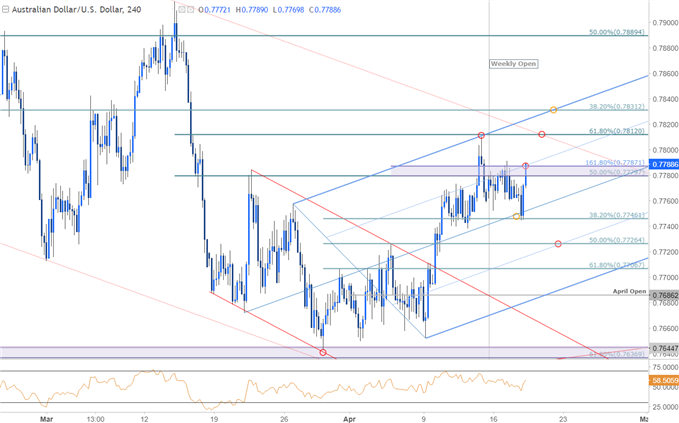
AUD/USD 240min Price Chart

Notes: A closer look at price action sees AUDUSD trading within the confines of an ascending pitchfork formation[6] with prices reversing off the upper parallel last week. Aussie found support at the median-line today and the focus is on another possible exhaustion stretch into 7812


