
In this series we scale-back and take a look at the broader technical picture to gain a bit more perspective on where we are in trend. Here are the key levels that matter on the weekly charts for the NZD/USD, GBP/USD and EUR/NZD. Review this week’s Strategy Webinar[1] for an in-depth breakdown of these setups and more.
Check out our New 2018 projectionsin our Free DailyFX Trading Forecasts[2]
NZD/USD Weekly Price Chart

Notes: Last month we noted that the New Zealand Dollar[3] had,“continued to consolidate below the January highs at 7436 with the 200-week moving average catching the closes on the downside over the past few months. I’m looking for a resolution to this key price range over the coming weeks with key support (bullish invalidation) eyed at 7094-7140.”
Price registered a low 7153 before turning higher with the advance now eyeing range resistance at 7390 (yearly high-close) and 7437 (yearly high)- note that the upper median-line parallel of the descending pitchfork (blue) AND the objective yearly opening-range[4] high converge on this zone and weekly breach/ close would be needed to validate a larger breakout in Kiwi.
Bottom Line: Price is approaching confluence down-trend resistance and the yearly range highs- Look for a reaction at this level with the immediate long-bias at risk while below. Key support remains at the 2015 slope support which converges on the 52 & 200-week moving averages at 7170/90.
New to ForexTrading? Get started with this Free Beginners Guide[5]
GBP/USD Weekly Price Chart
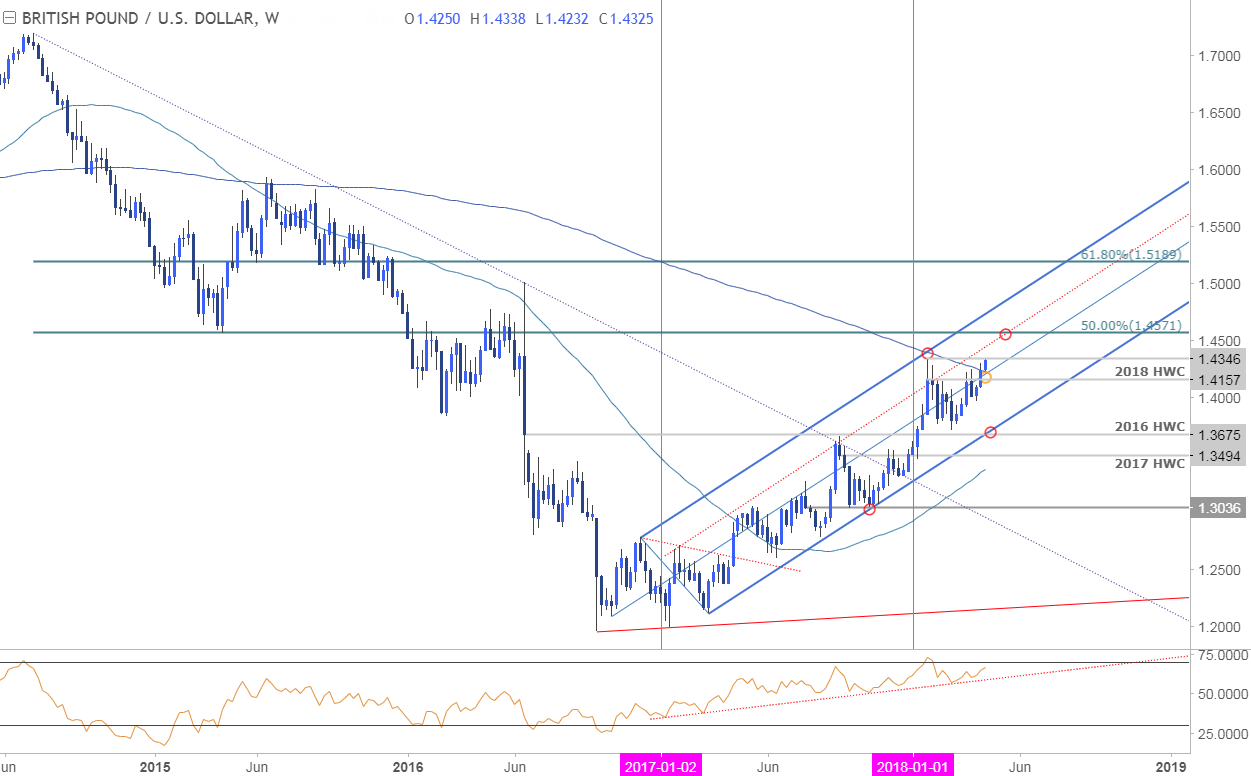
Notes:
