
The British Pound[1] has rallied more than 4.7% against the Japanese Yen[2] since the March lows with the advance now testing a key confluence resistance range. While the broader outlook does remain weighted to the topside, the rally may be at risk near-term while below this threshold.
GBP/JPY Daily Price Chart
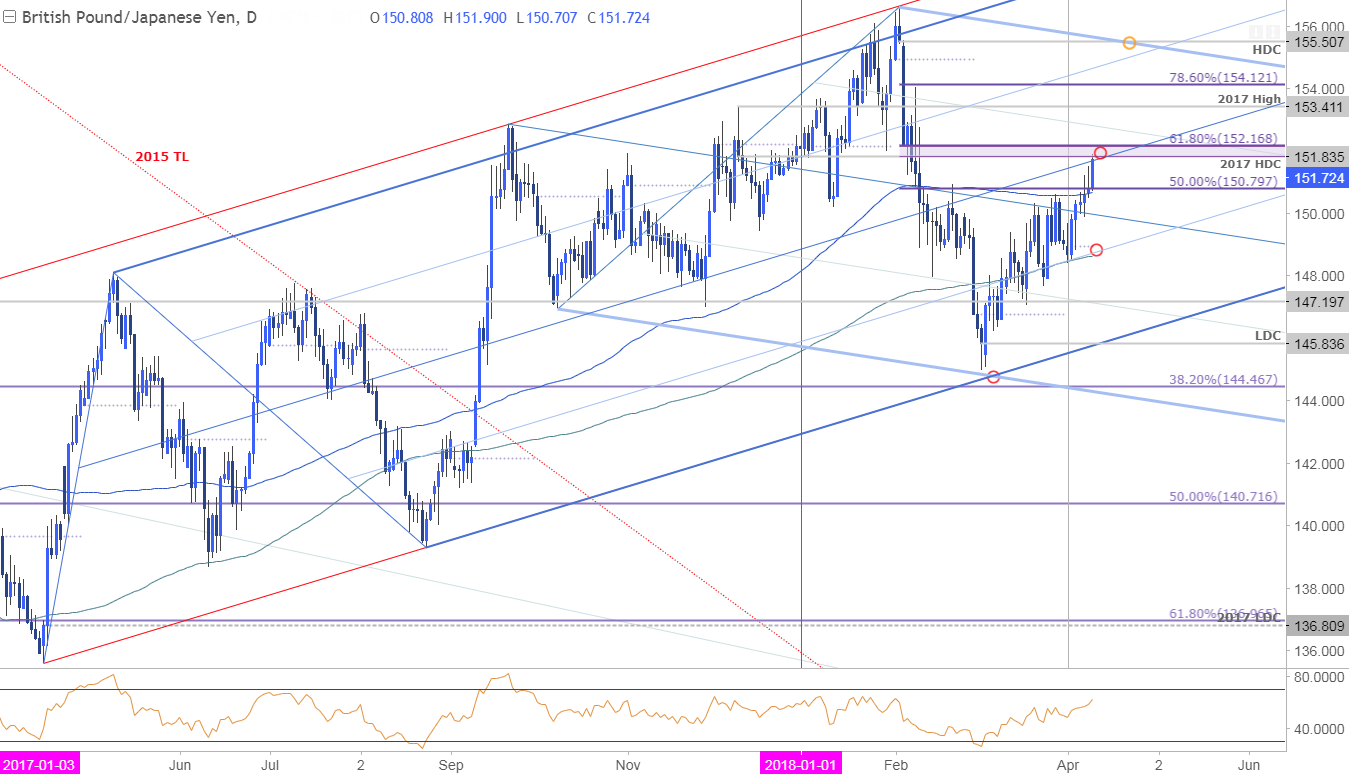
Technical Outlook: In this week’s Technical Perspective[3], we highlighted a confluence resistance zone in GBP/JPY around 152. The region in focus is 151.84-152.17 where the 61.8% retracement of the yearly range converges on the 2017 high-day close and slope resistance. The immediate advance is vulnerable while below this threshold.
New to Forex[4] Trading? Get started with this Free Beginners Guide[5]
GBP/JPY 240min Price Chart
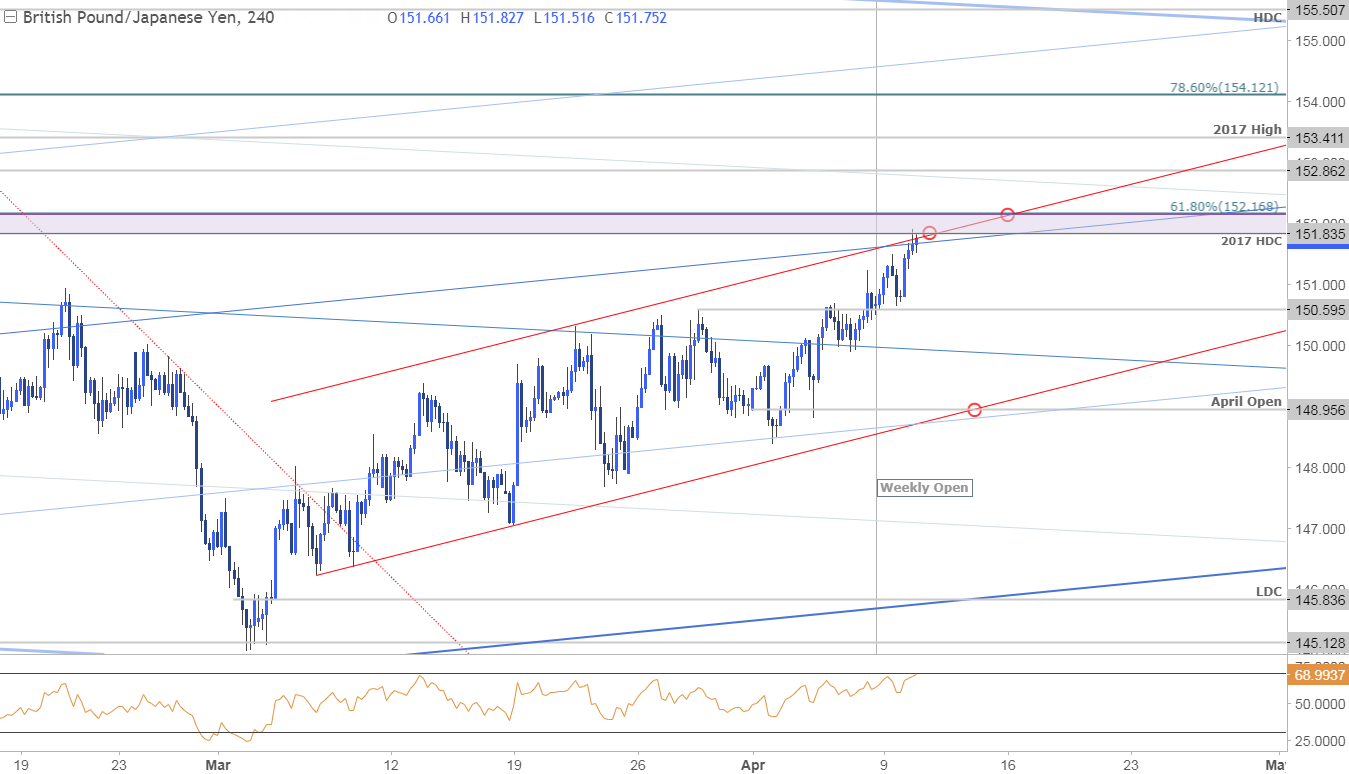
Notes: A closer look at price action see’s GBP/JPY trading within the confines of a near-term ascending channel[6] formation with the upper parallel further highlighting the 151.84-152.17 resistance zone. A breach above this region would likely fuel accelerated gains targeting 152.86, the 2017 high at 153.41 and the 78.6% retracement at 154.12.
Interim support rests at 150.60 with bullish invalidation now raised to the monthly open at 148.96- a break below this level would suggest a larger correction is underway targeting the low-day close at 145.84 (not the favored scenario).
Why does the average trader lose? Avoid these Mistakes in your trading[7]
Bottom line: Prices are testing up-trend resistance and a breach through this region would be needed to keep the immediate focus higher. That said, IF GBP/JPY is indeed heading
