
In this series we scale-back and take a look at the broader technical picture to gain a bit more perspective on where we are in trend. Here are the key levels that matter on the weekly charts for the EUR/USD, AUD/USD and GBP/JPY. Review this week’s Strategy Webinar[1] for an in-depth breakdown of these setups and more.
Check out our New 2018 projectionsin our Free DailyFX Trading Forecasts[2]
EUR/USD Weekly Price Chart
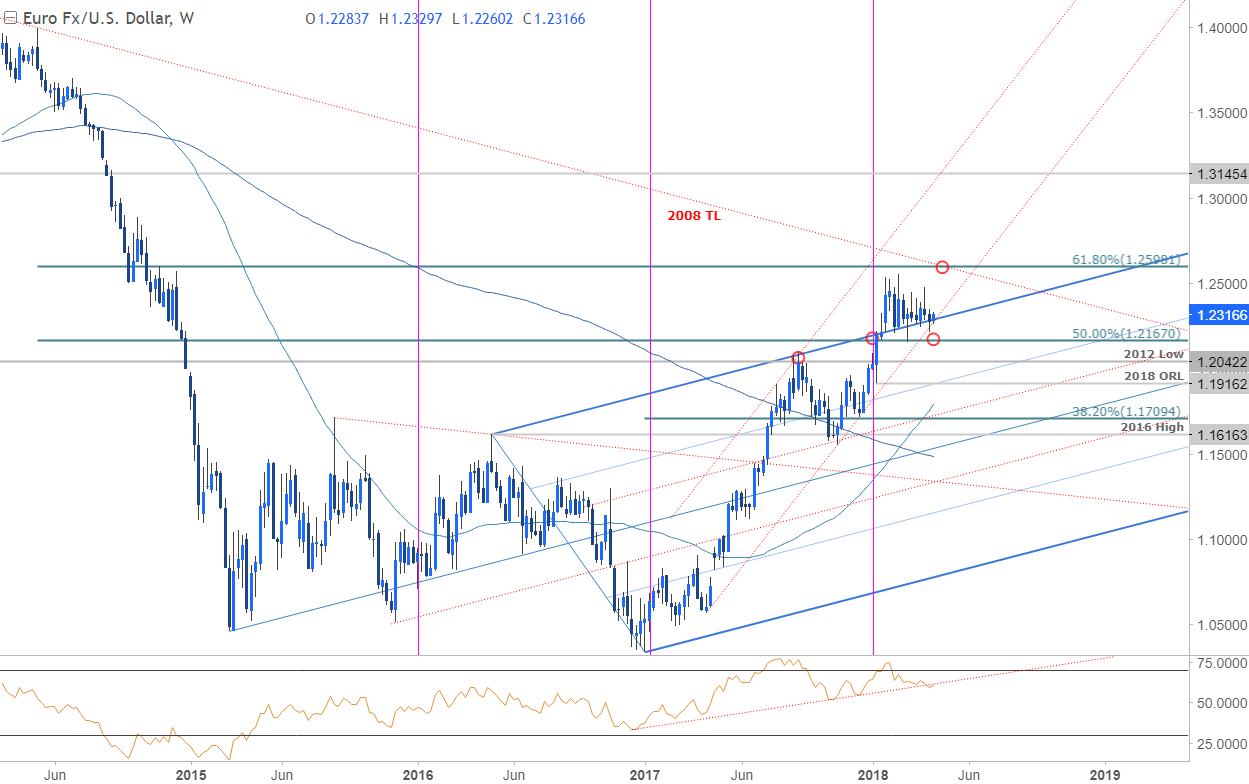
Notes: Euro[3] has continued to consolidate above former slope resistance (blue) of the broader ascending pitchfork formation we’ve been tracking since 2016. Channel support extending off the April 2017 low also converges on this zone[4] and further highlights the significance of this region this week. Note that weekly RSI closed below a three-point support trigger last week and casts a bearish stance on the momentum profile. Key resistance remains at 1.2598 where the 61.8% retracement of the 2014 decline converges on basic trendline resistance[5] extending off the 2008 high.
Bottom Line: Price is testing up-trend support and the broader, “focus remains on a break of the 1.2167-1.2598 range for guidance with the risk weighted to the topside while above 1.2167[6].” A breach / close above the yearly high-week reversal close at 1.2409 would be needed to mark resumption targeting 1.2558/98. A downside break of this support zone shifts the focus towards the 2017 high at 1.2092 and the 2012 lows at 1.2042.
New to ForexTrading? Get started with this Free Beginners Guide[7]
