As bitcoin prices hover above the $55k zone, a number of participants wonder when the bull run will end. Bitcoin proponents are convinced bull markets have three waves and another wave may start soon. However, despite a variety of tools being used like tarot cards, no one is truly sure what will happen with bitcoin and crypto markets next.
Counting Down the Days- Guesstimating Bitcoin Bull Runs
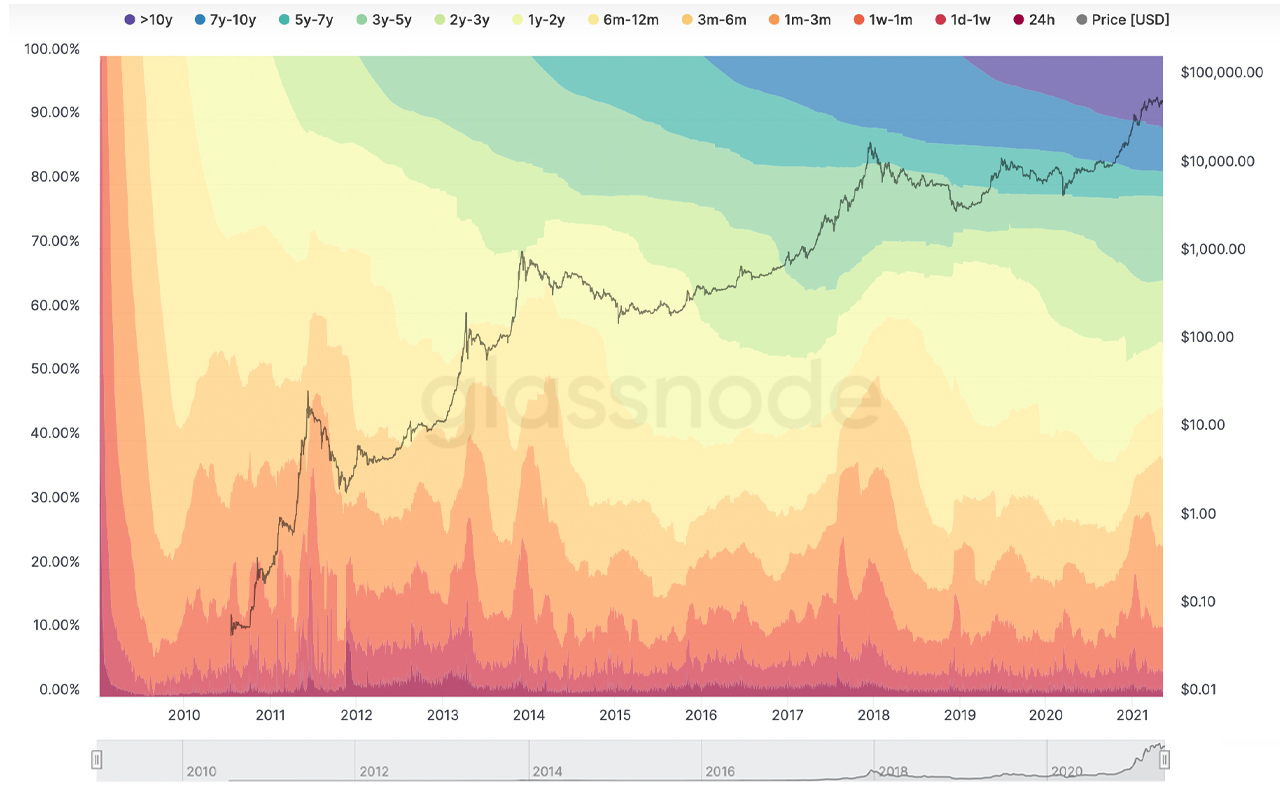
Bitcoin enthusiasts are still very optimistic about the price of the leading crypto asset and many believe the bull run is not over. Traders and those who are extremely curious about short-term price swings have been leveraging a number of tools in order to predict the future price of BTC. Tools and charts utilized include the stock-to-flow (S2F) model, logarithmic growth curves, golden ratio multiplier, HODL waves, profitable days and so much more.

For instance, the popular Twitter account Bitcoin Archive tweeted about realized cap HODL waves and shared an image from Glassnode’s platform to his 184,000 followers.


