
When bitcoin was first introduced, it had little to no value. Early adopters traded thousands of bitcoin for just a few dollars, until the infamous “Pizza Day” incident when Laszlo Hanyecz paid 10,000 BTC for two large pizzas, setting in motion a chain of events that lead to bitcoin’s value growing from a few cents to nearly $60,000 in just over a decade.
Bitcoin has come a long way since then, with large corporate institutions spending years denying its value as an investable asset, only to turn around and start investing in it themselves. Recently, PayPal introduced bitcoin as a payment method with millions of merchants that use its platform, celebrities like Paris Hilton joined the community and it seems that bitcoin is poised for even more growth.
By analyzing bitcoin’s past performance, it’s not impossible to get an idea of where its value is set to go next. Although many analysts and influencers alike have made bold predictions — like bitcoin growing to as much as $1 million — I thought it would be best to take a look for ourselves by analyzing each halving epoch, that is bitcoin’s performance between each halving event.
The chart below explores bitcoin’s value over the last 11 years, in four separate sections called the halving epochs:
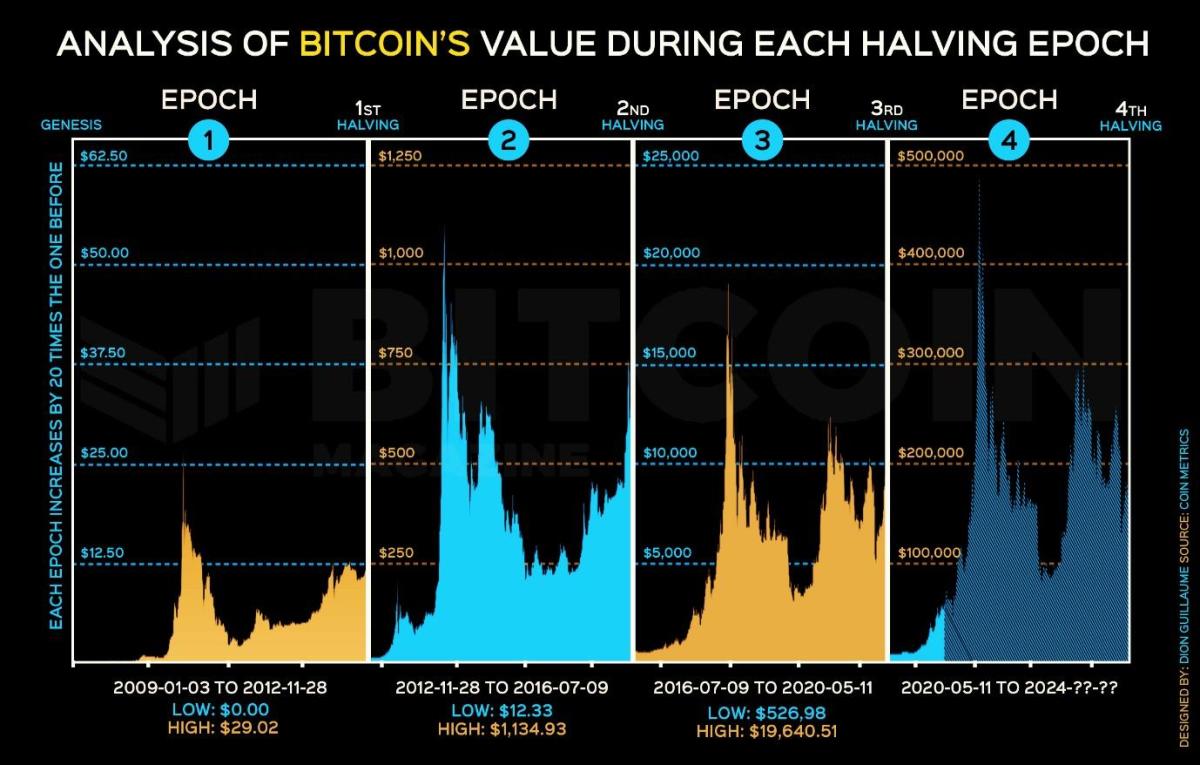
The chart was inspired by a similar one I recently came across, which lacked any projections that I felt necessary to predict where bitcoin is heading next. As mentioned on the chart, each epoch is 20 times larger than the previous one and covers the times between each halving event. When analyzing and comparing each epoch, a clear trend emerges.
Epoch 1: Genesis Block (2009-01-03) to First Halving (2012-11-28)
In the first epoch, bitcoin found its footing after first being released by Satoshi Nakamoto in 2009.
