
If LTC resumes upside and breaks above resistance near $238, a breakout above another key resistance zone could see bulls attack $300 or higher
Litecoin (LTC) is looking to bounce off support at $230 and target short-term resistance at $238. This follows a dip to lows of $220, which came after bears rejected bullish advances at the aforementioned zone. LTC is likely to bounce higher given the technical picture on the daily and 4-hour charts.
At the time of writing, Litecoin is trading at $234, slightly up over the past 24 hours by around 2.5%. The cryptocurrency, currently ranked 8th by market cap, is however stronger over the week as it remains 27% in the green zone.
Litecoin price upside picture
Litecoin price broke above resistance at $229 after its rejection near $240 sent it tumbling to $220. A clear break above the immediate resistance zone at $239 will likely see the LTC/USD pair move towards a three-year high. Beyond that, bulls will target the all-time high of $375.
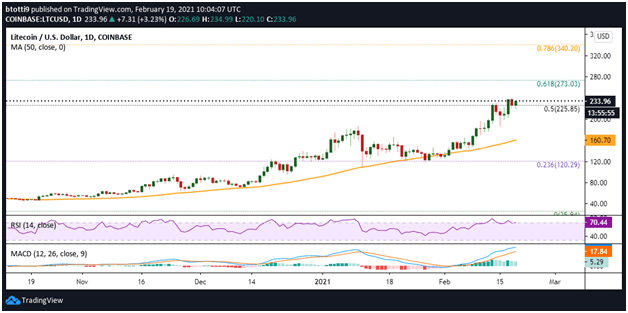
The daily RSI and MACD suggest bulls have room to maneuver to the above targets.
As the daily chart shows, the horizontal resistance line around $239 is the main hurdle before a potential retest of $273, a price level marked by the 0.618 Fibonacci retracement level of the move from $375 peak to $25 low.
If bulls succeed in breaching that barrier, the next target could be the psychological $300 and then the 0.786 Fibonacci retracement level ($340). Achieving this milestone would put $375 into focus, which is Litecoin’s all-time high reached on 19 December, 2017.
The 4-hour chart suggests a retest of the $240 hurdle is even more likely, with LTC trading higher within
