
DOT/USD broke above a crucial horizontal resistance level at $10.5 before surging to $12.20
Polkadot (DOT) has surged to a record high of $12.20 and looks likely to extend its gains beyond $14.00 in coming sessions. DOT is up by more than 35% in the past 24 hours and currently trades around $12.07 on Kraken at the time of writing.
The strong rally follows a break above a key horizontal resistance line at $10.50, which allowed bulls to build momentum above $11.00 and push higher.
The uptrend saw Polkadot climb into the fifth spot among the largest cryptocurrencies by market cap. At the time of writing, it has a market cap of $10.9 billion, behind struggling XRP that lies fourth with a market cap of $13.3 billion.
DOT/USD
DOT/USD has posted higher highs since its uptrend began after it dumped to lows of $7.20. Once bulls managed to retest and successfully broke above the $8.50 level, they targeted the$9.00 pivot level.
On the 4-hour chart, DOT/USD managed to break above a descending trend line and the 61.8% Fibonacci retracement level of the downward move from $10.70 high to $7.20 low. The levels had capped prices near $9.38, but turning it into support allowed bulls to target and retest the 76.4% Fib retracement level at $9.90.
The upside also included a break above a horizontal resistance line at $10.50, with bulls surging to the all-time high of $12.20.
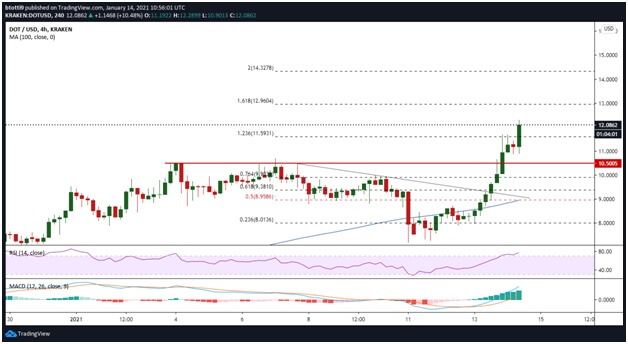
DOT/USD 4-hour chart. Source: TradingView
Currently, bulls are looking to sustain momentum above the 123.6% Fibonacci extension level ($11.59) on the 4-hour chart. The RSI is still rising but has not extended into the overbought territory, and the MACD is showing strength in the bullish zone.
These positives give bulls the
