
NEM (XEM) looks poised for a bearish rally and may fall below $0.20 level if sell-off pressure mounts
NEM (XEM) has seen selling pressure push its value to lows of $0.191, though a slight recovery has seen bulls attempt at breaking higher.
However, the cryptocurrency market is facing widespread sell-off pressure and NEM price could drop below $0.20. This perspective will strengthen if bulls fail to keep the critical support level around $0.205.
The XEM/USD pair is currently changing hands around $0.208, around 24% lower in the past 24 hours. The XEM/BTC pair is also trading lower at 0.00000912 (-23.86%) at the time of writing.
XEM/USD daily chart
The daily chart shows that XEM/USD has broken below the 20-EMA and is likely to tank past the 50-EMA, allowing for more downside pressure. With price trading around $0.208, there’s a chance bears will break the support wall around the $0.205 (50-EMA).
Sellers could push XEM to $0.18 and then target 26 November lows of $0.13.
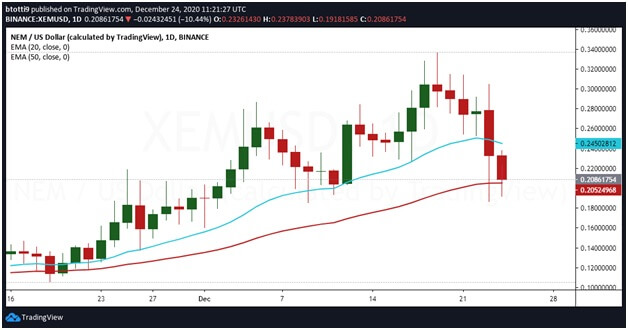
XEM/USD price daily chart. Source: TradingView
XEM/USD 4-hour chart
The 4-hour chart is signalling the formation of a Long-Legged Doji candlestick after the massive retracement witnessed over the past few days. The head and tail of the candle indicate the dramatic price action during the session as both bears and bulls battle to take control.
It’s likely the bears will remain in control if the Doji candle is as it is at close, while the bearish trend will be strengthened if a Gravestone Doji appears. The candlestick supports the trading action in the past few hours, with buyers pushing higher but ultimately it appears that they will not be able to maintain the momentum.

XEM/USD 4-hour chart. Source: TradingView
The
