
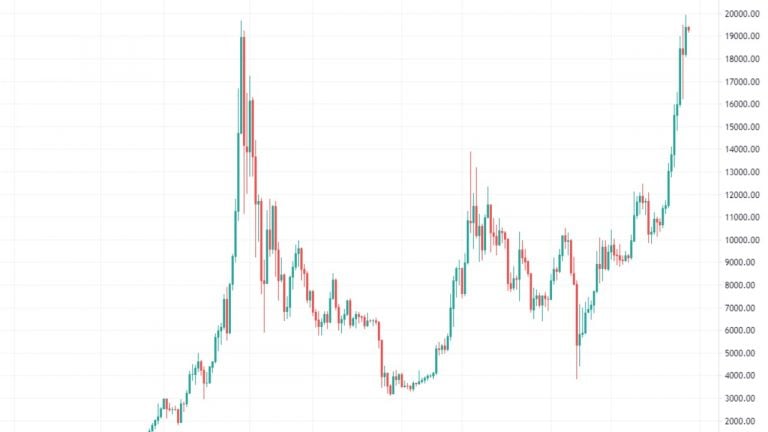
BTC is often a good macro indicator for the entire crypto market, so this is a good place to start. Bitcoin (BTC) has recently surpassed its all-time high price just shy of $20,000, so it’s a unique time to zoom out and look at the weekly chart for the past several years.

The last several weeks have been a rocket ride, and we’re now bumping up against the technical resistance level of $20,000. Amidst the bullish sentiment fueled by corporate investors such as MicroStrategy, this could appear as resistance that will soon break. The leg up from $11,000 was particularly strong, and this kind of move often has a second leg. So the market is looking quite bullish indeed.
Nevertheless, bears will also see shorting the $20,000 level as a trade. Typically, selling at resistance is a low probability (but good risk/reward) trade, as this kind of trade usually involves a tight stop. If the bulls fail to conquer the 21k handle, then price may slump. Aggressive bears will set stops there, hoping to see a sell off to $17,000 or more.
Zooming into the daily chart, price is in a tight channel. We’re seeing the straight up price action on a more detailed scale. You can see price consolidating recently as it encounters the $20,000 resistance level.

Runaway trends are always hard to trade since putting on a big position after a big run-up in price is risky. One strategy is to put on a small position as soon as you know the trend is in play. You can then manage the trade and add on later at either higher or lower prices, and more information is made available to you by the market
