
Disclaimer: The findings of the following article attempt to analyze the emerging patterns in Ethereum’s short-term market and its impact on the price
The altcoin market has entered a consolidation phase after marching side by side with Bitcoin. Ethereum[1], the second-largest cryptocurrency has also been following a similar path as the price of the digital asset broke out.
The current value of ETH was $484.29.
Ethereum 4-hour Chart
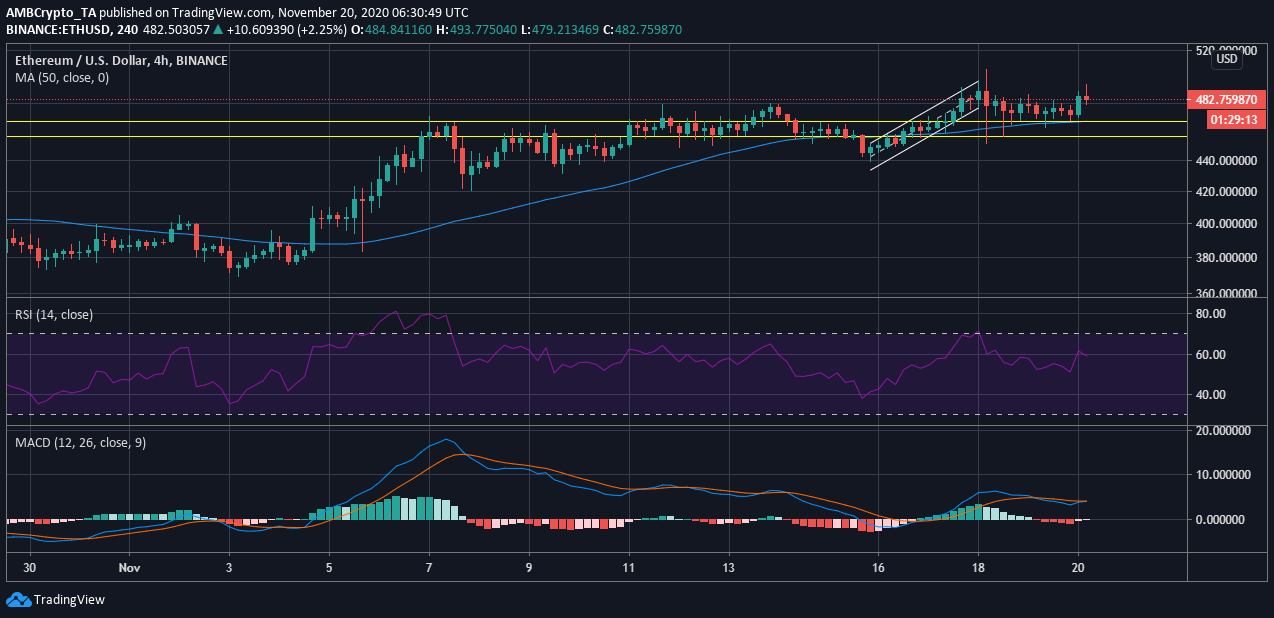
Source: ETH/USD[2] on TradingView
The above chart indicated the price surge experienced in the ETH market over the past couple of days. This surge pushed the price of ETH higher noting a higher high. It formed a part of an ascending channel, which saw a break down of the price of ether.
The breakdown resulted after the value of the digital asset breached $500. At $504, the price of ETH began to sell and the large red candle indicated the intense push and pull by the traders, as the low point for the asset’s value was marked at $451.76. This sudden price change pushed past the two supports visible in the market at $466 and $456.
However, as the immediate pressure was released, the price of ETH was bouncing from the support at $466 and has remained above this point since. Even though the price has bounced back, the market still leans towards a bearish side as consolidation continues.
Reasoning
The consolidation was visible with the Relative Strength Index. The RSI had just touched the overbought zone and has been trying to reach equilibrium. The value recently reached 50 but has been moving closer to the overbought zone.
Whereas, MACD indicated that the asset may witness a potential crossover, which could be a sign for a trend reversal. The MACD line has been intertwined with
