

Analysts are always seeking new ways to assess cryptocurrencies. Different metrics provide insights that can be used to gauge various trends, such as estimating when a particular asset has bottomed out and is due to rise. The Altcoin Correction Index provides an unvarnished snapshot of this year’s worst performing cryptos.
Also read: Blockchain, Reloaded: How the New “Matrix” Appeared
Altcoins Haven’t Performed This Badly Since 2014
Whatever metric you choose to apply, altcoins aren’t looking so pretty this year. Just one crypto asset in the top 100 is in the green (BNB) while everything else is down an average of 70-90%. It doesn’t require sophisticated analytical tools to appreciate the extent of the altcoin bloodbath that has occurred. Nevertheless, historical trends can provide an indicator, some believe, as to when the worst may be over and a recovery can be expected. Fundstrat Global founder Thomas Lee has shared a chart he’s labeled the Altcoin Correction Index. It shows the percentage of altcoins that are down 70% from their 9-month high:
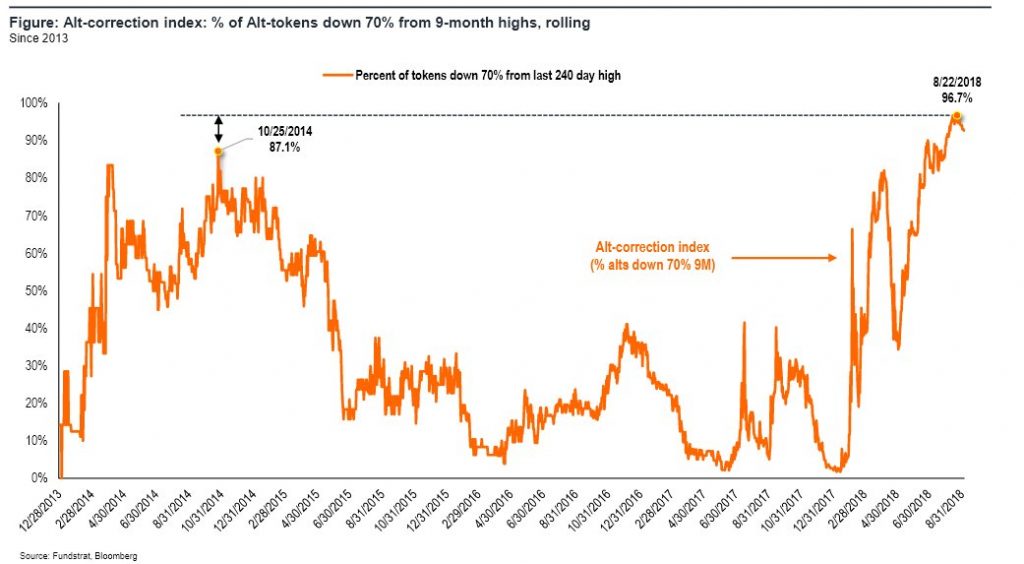
Websites such as Onchainfx are useful for viewing the number of days since an altcoin’s all-time high (ATH) and the percentage it is down. It’s easy to pick out particularly bad performers such as einsteineum (-98%), salt (-98%), and bitcoin diamond (-97%). Fundstrat’s Altcoin Correction Index is arguably more useful however in charting the average drop across the board, rather than focusing on outliers. With 97% of altcoins down over 70% from their ATH, nine months ago, the market has reached a low not seen since 2014.
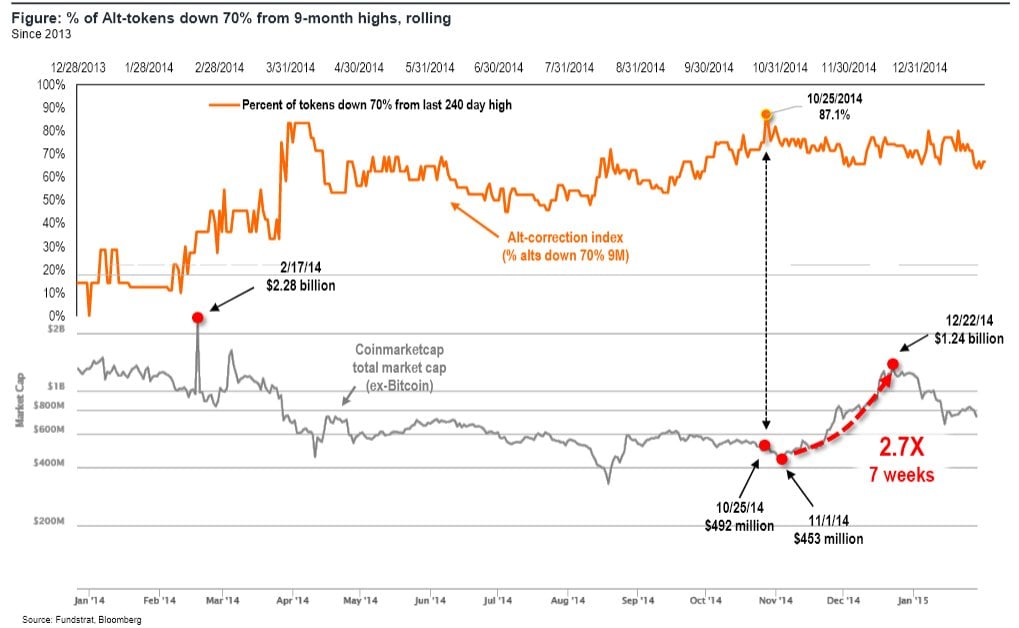
In 2014, Altcoins Were Decimated
While out of touch economists continue to bang on about
