
In our previous discussion, a strong possibility for a retest of the low volume spring was noted as the market was beginning the early stages of an inverted head-and-shoulders (H/S) reversal (sometimes called a head-and-shoulders bottom). A couple days ago, shortly after testing the left shoulder of the head-and-shoulders reversal (H/S), the market reacted strongly and the price jumped several hundred dollars:
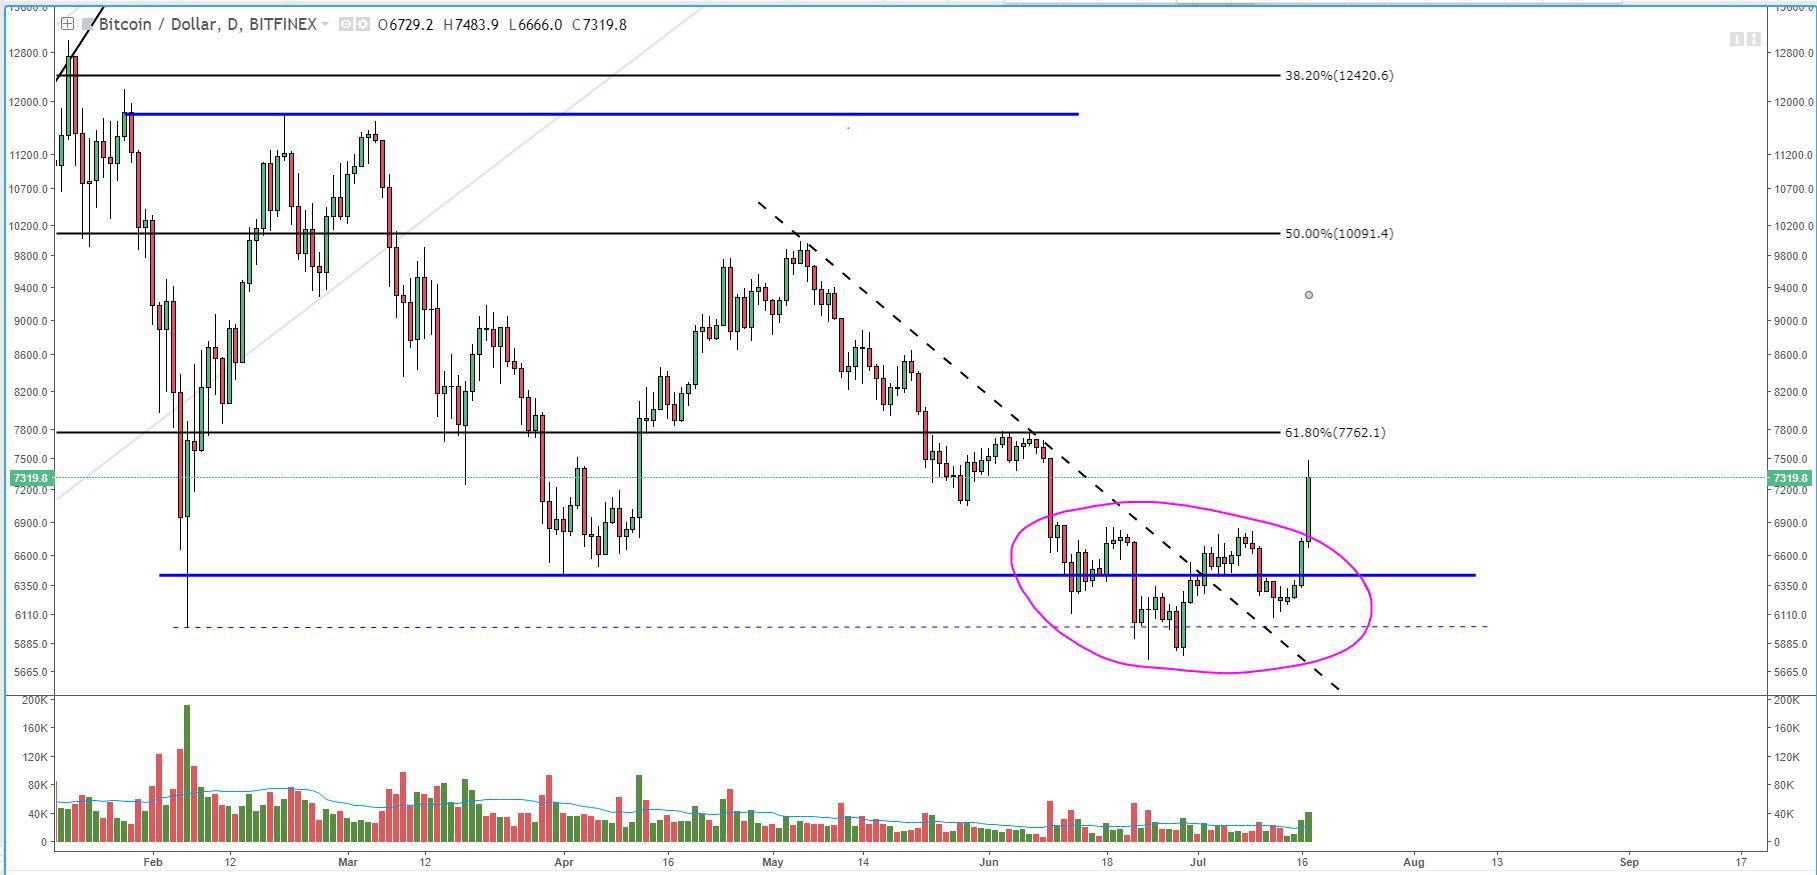 Figure 1: BTC-USD, 1-Day Candles, H/S Bottom
Both the candle spread and volume have been quite high over the last two daily candles. High volume and large spread following a low volume spring hint toward a potential accumulation characteristic called a “Jump Across the Creek” (JAC). In a trading-range sense, the whole purpose of an accumulation trading range (TR) is to shake out all the sellers so that an asset can be pushed to higher price levels with minimal interference by overhanging supply.
While the accumulation argument is still up for interpretation, it is gaining several checkmarks with today’s market activity. Overall, throughout the life of the TR, the total volume has declined — typically a sign of supply absorption and overall declining seller interest. However, the spread and volume that reacted from the weekend lows showed a strong buyer interest, hitting the market as the H/S bottom nearly completed its entire measured move in about five hours.
So, what’s next?
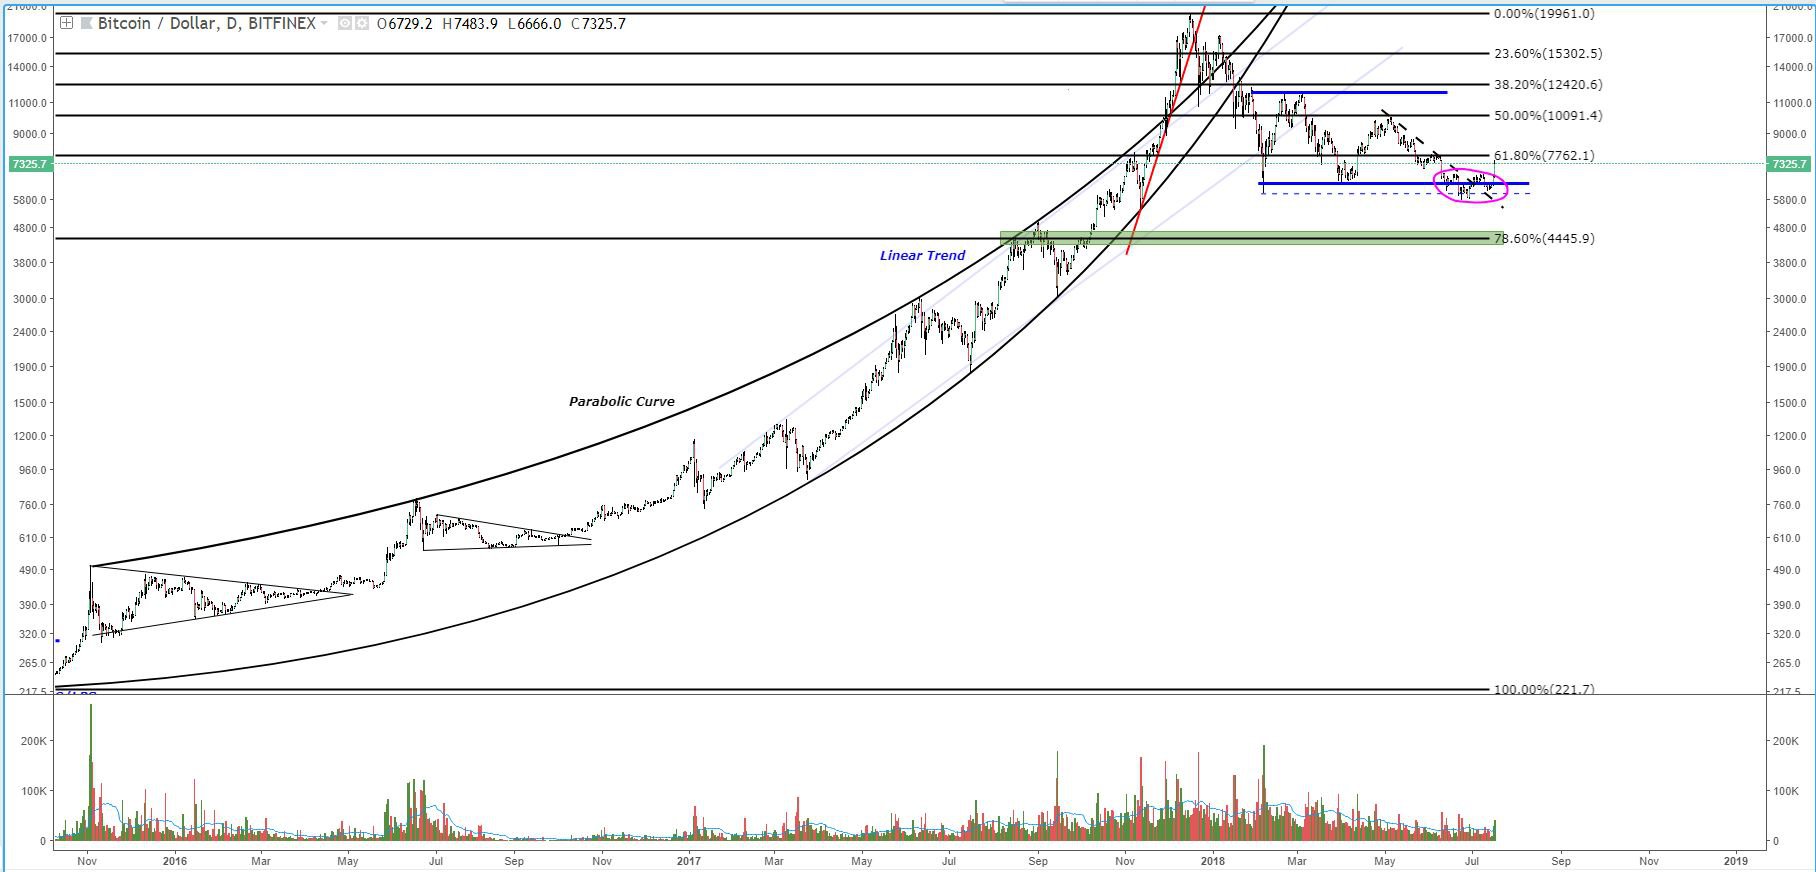 Figure 2: BTC-USD, 1-Day Candles, Macro Fib Levels
The next major obstacle for the bulls to tackle is the $7,700s. This has historically been a strong battleground between the bulls and the bears, and there is a major resistance level established at the 61% macro Fibonacci retracement values. Because the strong, bullish move is so new, it’s difficult to tell how far it will continue because it hasn’t had a chance to pull back and test
